Try it on your own data
Every report in this article is in the free plan. One snippet for web and apps, up to 10 sites.
Start freeWebsite performance metrics tell you how fast your pages feel to real visitors: how quickly content appears, how fast the page responds to a tap and how much it jumps around. This guide covers the five metrics worth watching, their thresholds, why to read the 75th percentile from real users rather than a single lab test, and how to trace a slow page to its cause.
What you will learn
- Watch five metrics: LCP, INP and CLS (Core Web Vitals), plus FCP and TTFB to explain them
- Read the 75th percentile from real users, split by page and device
- Use the load timing split (backend, network, frontend) to find where time goes
Which metrics matter
Hundreds of timings can be measured. Five cover what visitors feel:
- LCP: when the main content, usually the biggest image or heading, is visible.
- INP: how long the page takes to respond to clicks, taps and key presses.
- CLS: how much content moves while the page loads.
- FCP: when anything first appears.
- TTFB: when the server starts sending the page.
LCP, INP and CLS are the Core Web Vitals. FCP and TTFB help explain why LCP is slow. The table lists the thresholds.
| Metric | What it measures | Good | Poor |
|---|---|---|---|
| LCP | When the main content is visible | ≤ 2.5 s | > 4 s |
| INP | How quickly the page responds to input | ≤ 200 ms | > 500 ms |
| CLS | How much the layout jumps | ≤ 0.1 | > 0.25 |
| FCP | When the first content appears | ≤ 1.8 s | > 3 s |
| TTFB | When the first byte arrives from the server | ≤ 0.8 s | > 1.8 s |
Between good and poor is "needs improvement".
Lab tests vs real users
A lab test loads a page once, from one machine, on one network. It is useful for debugging but it is not what your visitors experience. Real-user data comes from every visit, on every device and network.
Read the 75th percentile (P75): three in four visits were at least this fast. An average hides the slow tail; the percentile shows it.
Read by page and device
Performance varies more between pages than between days. Split by page template and device:
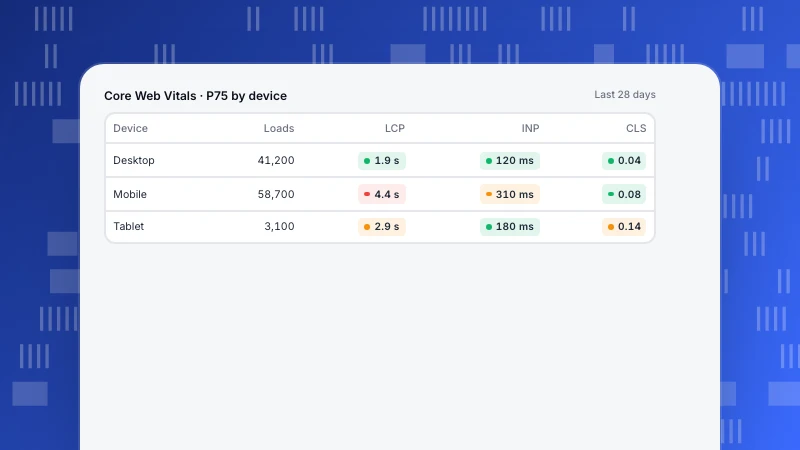
- Mobile vs desktop. Mobile is usually slower; judge it on its own.
- Page templates. Search, category and checkout pages often depend on slow backend calls.
- Country. Distance from the server shows in TTFB.
A worked example
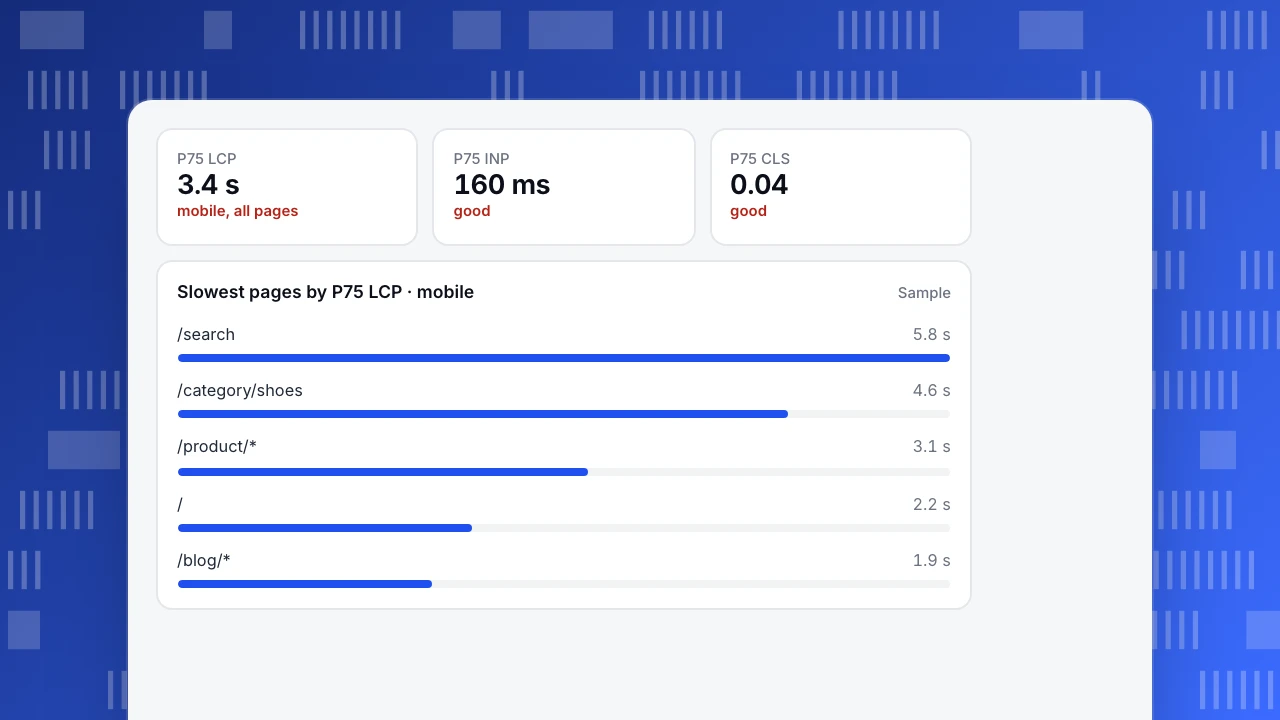
A shop sees P75 LCP of 3.4 s on mobile, in the "needs improvement" band. The slowest pages list, sorted by P75 LCP, puts /search and /category pages on top. Their load timing split shows most time is backend: TTFB above 2 s while frontend time is normal.
The team adds caching for category listings and a faster search index. Two weeks later, P75 LCP on those pages is under 2.5 s, and mobile site-wide P75 LCP falls to 2.4 s.
P75 LCP
3.4 s
mobile, all pages
P75 INP
160 ms
good
P75 CLS
0.04
good
Slowest pages by P75 LCP · mobile
SampleIn TapCub
Performance cards switch between P95, P75, median and average, and the trend and breakdown use P50, P75, P90 and P99. You can break down by page, country, device, browser and OS. Load timing splits backend, network and frontend, and the slowest pages are sorted by P75 LCP. A 0 to 100 score combines LCP, INP and CLS. Vitals are sent once per page when it is hidden, and can be turned off with data-vitals="false".
A short routine
- Check P75 LCP, INP and CLS on mobile each month.
- Open the slowest pages and look at the timing split.
- Fix the largest share first: backend, network (CDN, image size) or frontend (scripts, render blocking).
- Re-check two weeks after the fix, by the same page and device.
For field data in general, see real user monitoring.
FAQ
What are the most important website performance metrics?
LCP, INP and CLS, the Core Web Vitals, with FCP and TTFB to explain them.
What is a good page load time?
Aim for LCP of 2.5 seconds or less at the 75th percentile of real visits.
Why does my lab score differ from real-user data?
A lab test runs once on one setup. Real-user data covers every device, network and location your visitors use.
See also: First input delay (FID), Page experience, Web performance monitoring.
Was this article helpful?
We use your answers to fix and expand this page.
Couldn’t send. Please try again in a minute.
Thanks for the feedback. We’ll use it to improve this page.You’ve already sent feedback on this page. Thanks.

Technical Engineer
Focuses on tracking code, SDKs, and API integrations, with practical guidance on implementation checks and troubleshooting.