Try it on your own data
Every report in this article is in the free plan. One snippet for web and apps, up to 10 sites.
Start freeProduct analysts turn product usage data into decisions. This guide explains the five recurring jobs, what a typical week looks like, and works through one real-style analysis from question to recommendation. It also compares the role with data analysts, data scientists and product managers.
What you will learn
- A product analyst defines metrics, owns tracking, answers questions, measures changes and builds shared views
- Good analysis states the comparison, tests for noise, rules out other explanations and ends in a recommendation
- SQL, product analytics tools, basic statistics, product sense and clear writing matter most
The role in one sentence
A product analyst helps a product team decide what to build and whether it worked, using data about how people actually use the product.
They sit close to product managers, designers and engineers, and usually own the product's metrics, its tracking and the analysis behind major decisions.
Five recurring jobs
- Define metrics. What counts as an active user, an activated account, a retained customer. Write the definitions down so everyone counts the same way.
- Own tracking. Plan which events and properties the product sends, review them before release and check them after. See data taxonomy.
- Answer questions. "Where do new users drop off?", "Who uses this feature?", "Why did weekly actives fall?" Most of the job is here.
- Measure changes. Before and after a launch, or an experiment run in a testing tool: did it move the metric, and by how much?
- Build shared views. Dashboards and reports the team uses every week, so routine questions do not need an analyst.
A typical week
- Monday: review the weekly metrics dashboard, flag anything unusual to the team.
- Tuesday–Wednesday: one deeper analysis, such as why mobile activation is lower.
- Thursday: review the tracking plan for next sprint's features with engineers.
- Friday: write up results, answer quick questions, clean up a dashboard.
A worked analysis: did the onboarding change work?
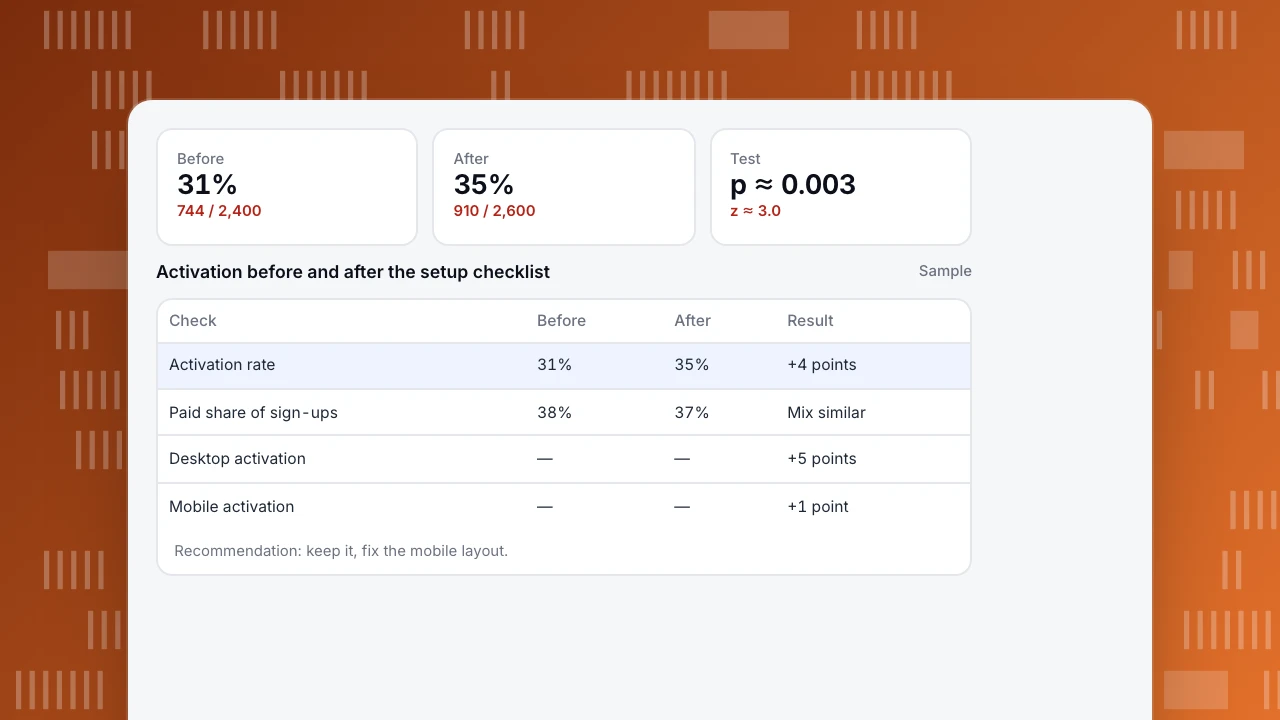
The team shipped a setup checklist for new accounts. The analyst is asked whether it improved activation (installed tracking and viewed a report within 7 days). Sample numbers throughout.
1. Define and compare. Four weeks before launch vs four weeks after, same definition:
- Before: 744 of 2,400 sign-ups activated (31%)
- After: 910 of 2,600 sign-ups activated (35%)
2. Is it more than noise? A two-proportion test gives z ≈ 3.0 and p ≈ 0.003. Unlikely to be chance.
3. Could something else explain it? The analyst checks the channel mix: paid sign-ups were 38% of the total before and 37% after, so a change in traffic does not explain the lift. There was no pricing change or holiday in either period.
4. Where did it help? Split by platform: desktop +5 points, mobile +1 point. The checklist is hard to use on small screens.
5. Recommendation. Keep the checklist; fix the mobile layout; check mobile activation again in four weeks.
This is a before/after comparison, not a randomised experiment, so the write-up says so and lists the checks made.
Before
31%
744 / 2,400
After
35%
910 / 2,600
Test
p ≈ 0.003
z ≈ 3.0
Activation before and after the setup checklist
Sample| Check | Before | After | Result |
|---|---|---|---|
| Activation rate | 31% | 35% | +4 points |
| Paid share of sign-ups | 38% | 37% | Mix similar |
| Desktop activation | — | — | +5 points |
| Mobile activation | — | — | +1 point |
Recommendation: keep it, fix the mobile layout.
How it compares with related roles
The table below compares the product analyst with roles it is often confused with.
| Role | Main question | Typical output |
|---|---|---|
| Product analyst | How do people use the product, and did a change work? | Metrics, funnels, retention, launch reviews |
| Data analyst | What happened in the business? | Reports across sales, finance, marketing, operations |
| Data scientist | What will happen, and what model can predict or optimise it? | Models, forecasts, experiment methods |
| Product manager | What should we build next, and why? | Roadmap, specs, decisions |
| Growth analyst | Which changes move acquisition, activation or revenue? | Experiment analysis, growth models |
Titles vary by company; small teams often combine these roles.
Skills that matter
- SQL and comfort with event data.
- Product analytics tools: funnels, retention, segments, paths.
- Basic statistics: rates, confidence intervals, significance, and their limits. See how to analyze data.
- Product sense: knowing which question matters to the decision.
- Writing: a short, clear conclusion the team can act on.
Tools, and where TapCub fits
Product analysts typically use a product analytics tool, SQL against a warehouse, a spreadsheet and a dashboard tool. In TapCub:
- All-platform analytics › Behavior › Behavior analysis covers events, funnels, retention, paths and distributions, with breakdowns by any property.
- All-platform analytics › Behavior › Metrics & SQL holds shared metric definitions and SQL for questions the models do not cover.
- All-platform analytics › Data › Tracking plan is where planned events and required properties live.
- All-platform analytics › Overview › My dashboards collects saved analyses for the weekly review.
Related: product usage analytics and growth team.
See also: Product engineer.
See also: Analytics for product managers.
Was this article helpful?
We use your answers to fix and expand this page.
Couldn’t send. Please try again in a minute.
Thanks for the feedback. We’ll use it to improve this page.You’ve already sent feedback on this page. Thanks.

Product Analyst
Focuses on event analysis, conversion funnels, and retention, using clear metric definitions and structured analysis to explain product performance.