Try it on your own data
Every report in this article is in the free plan. One snippet for web and apps, up to 10 sites.
Start freeA growth team owns one number and changes whatever moves it. This guide explains what the team owns, three ways to structure it, the roles, and the weekly experiment loop, then walks through a sample quarter in which 10 experiments raised activation by five points.
What you will learn
- A growth team owns one metric and can change anything that moves it
- Most experiments do not win; the value is in running enough and stopping losers fast
- Start one only after product-market fit and reliable tracking
What a growth team is
A growth team is a small, cross-functional group that owns one growth metric (activation, conversion to paid, retention, referrals) and improves it through a steady flow of small changes and experiments.
It differs from a marketing team, which owns channels and campaigns, and from a product team, which owns features. A growth team owns a number and is free to change whatever moves it: onboarding, pricing pages, emails, in-product prompts.
Three ways to structure it
The table below compares the three common models.
| Model | How it works | Good for | Risk |
|---|---|---|---|
| Independent | Separate team with its own engineers, reports to a growth lead | Fast experiments across the whole funnel | Friction with product teams over shared screens |
| Functional (embedded) | Growth people sit in existing product or marketing teams | Small companies, close collaboration | Growth work loses to feature work |
| Hub and spoke | Central growth group sets method and data; work happens in product teams | Larger companies with several products | Needs strong leadership to stay coordinated |
Many companies start embedded and move to independent once growth work competes for engineers.
Core roles
- Growth lead: owns the metric, the backlog and the decisions.
- Engineer(s): ship changes quickly, often on onboarding and sign-up flows.
- Designer: shapes copy and screens; often part-time.
- Analyst (or a lead strong in data): sets up tracking, sizes ideas, reads results.
- Marketer: owns lifecycle email and acquisition tests when the metric needs them.
A first team can be three people: lead, engineer and someone who can do the analysis.
The weekly loop
- Collect ideas from data, customer interviews, support and the team.
- Score them with a simple method such as ICE: impact, confidence and ease, each 1–10, averaged.
- Pick and run the top few, each with a written hypothesis, a metric and a stop date.
- Review results every week: ship, roll back, or learn and try a variant.
- Write down what was learned, especially from failures.
A worked quarter
A SaaS growth team owns activation: new accounts that install tracking and view a report within 7 days. It starts the quarter at 31% (sample numbers throughout).
- 24 ideas scored with ICE, for example: setup checklist after sign-up 7.7, install guide matched to platform 6.7, shorter sign-up form 6.5, annual plan discount 6.3, invite-a-teammate prompt 6.0, pricing page redesign 4.7.
- 10 experiments run over 12 weeks.
- 3 positive: setup checklist (+2.0 points), install guide matched to the visitor's platform (+1.5), shorter sign-up form (+1.5).
- 5 neutral: no measurable change; learnings recorded.
- 2 negative: rolled back within a week.
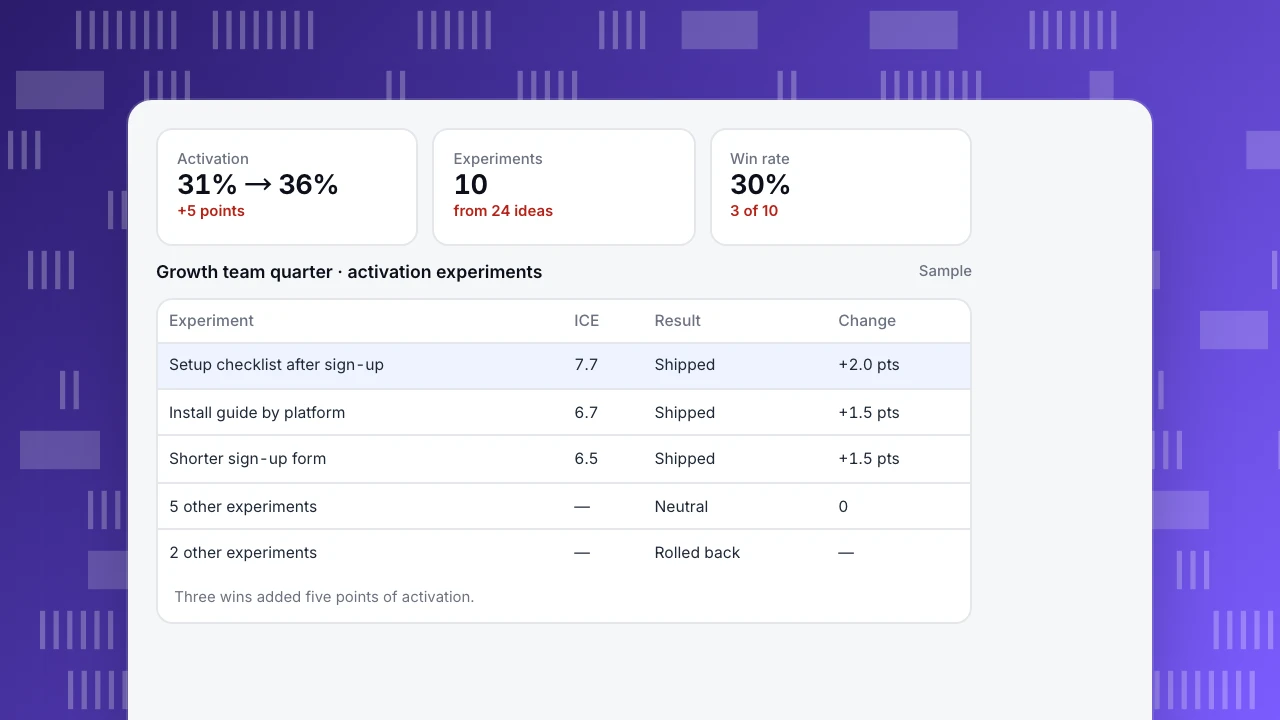
Result: activation 31% → 36%, a win rate of 30%. That ratio is typical: most experiments do not win, and the team's value is in running enough of them, and stopping losers fast.
Activation
31% → 36%
+5 points
Experiments
10
from 24 ideas
Win rate
30%
3 of 10
Growth team quarter · activation experiments
Sample| Experiment | ICE | Result | Change |
|---|---|---|---|
| Setup checklist after sign-up | 7.7 | Shipped | +2.0 pts |
| Install guide by platform | 6.7 | Shipped | +1.5 pts |
| Shorter sign-up form | 6.5 | Shipped | +1.5 pts |
| 5 other experiments | — | Neutral | 0 |
| 2 other experiments | — | Rolled back | — |
Three wins added five points of activation.
When to start one
- Not yet if you have not found product-market fit: growth work amplifies retention, it cannot create it. See product-market fit metrics.
- Not yet if tracking is unreliable: the team will argue about numbers instead of improving them.
- Start when there is enough traffic to see changes within weeks, a clear metric and leadership willing to let the team touch other teams' areas.
Data the team needs
TapCub does not split traffic for experiments; use your testing or feature-flag tool for that, and send the variant as an event property. TapCub then gives the team:
- Funnels and retention by any event property in All-platform analytics › Behavior › Behavior analysis, so each variant's activation is visible.
- Goals for website steps in Web analytics › Goals.
- Annotations for each launch and rollback, so the activation trend shows what changed when.
- Monitors that alert when activation or sign-ups move outside the expected range.
Related: growth marketing, product-led growth metrics, north star metric and growth loop.
Was this article helpful?
We use your answers to fix and expand this page.
Couldn’t send. Please try again in a minute.
Thanks for the feedback. We’ll use it to improve this page.You’ve already sent feedback on this page. Thanks.

Growth Strategist
Explores acquisition channels, activation, and conversion experiments, turning data insights into actionable growth hypotheses and evaluation methods.