Try it on your own data
Every report in this article is in the free plan. One snippet for web and apps, up to 10 sites.
Start freeGrowth marketing is often described as a mindset. In practice it is a loop: measure the funnel, pick the biggest leak, test a change and record what you learn. This guide shows the loop with a sample funnel and backlog, and lists the metrics for each stage.
What you will learn
- Growth marketing covers the whole journey, from first visit to retention and referral
- Work on the stage where improvement moves the end result most; often that is activation, not traffic
- Score ideas, test one change at a time, and record the result
What is growth marketing?
Growth marketing is marketing that works on the whole customer journey, from first visit to sign-up, first value, payment, retention and referral, and improves it through a steady series of measured experiments. Traditional marketing usually stops at the lead or the sale. Growth marketing keeps going, because a customer who leaves after a month is a cost, not a win.
It borrows from product work: data to find the problem, a hypothesis, a small test, and a decision based on the result. Many teams frame the journey with AARRR (acquisition, activation, retention, referral, revenue).
Growth marketing vs traditional marketing
The difference is less about channels and more about scope and method, as the table below shows.
| Traditional marketing | Growth marketing | |
|---|---|---|
| Scope | Awareness to lead or sale | Whole journey: acquisition to retention and referral |
| Method | Campaigns planned in advance | Continuous small experiments |
| Success measure | Reach, leads, campaign ROI | Activated, retained and paying customers |
| Team | Marketing alone | Marketing, product, data and engineering together |
| Cadence | Quarterly campaigns | Weekly or bi-weekly test cycles |
Growth marketing does not replace brand and campaigns; it adds measurement and iteration across the funnel.
The growth loop in five steps
- Measure the funnel. Get reliable numbers for each stage before changing anything.
- Pick the biggest leak. Work on the stage where improvement moves the end result most. Often that is not acquisition.
- Write a hypothesis. "If we cut the sign-up form from 7 fields to 4, sign-up rate will rise from 3.0% to 3.5%."
- Run a small test. One change, a clear metric, a fixed end date, and guardrails that must not get worse.
- Decide and record. Ship, drop or iterate, and write down what you learned so the next idea starts from it.
A sample: finding the stage to work on
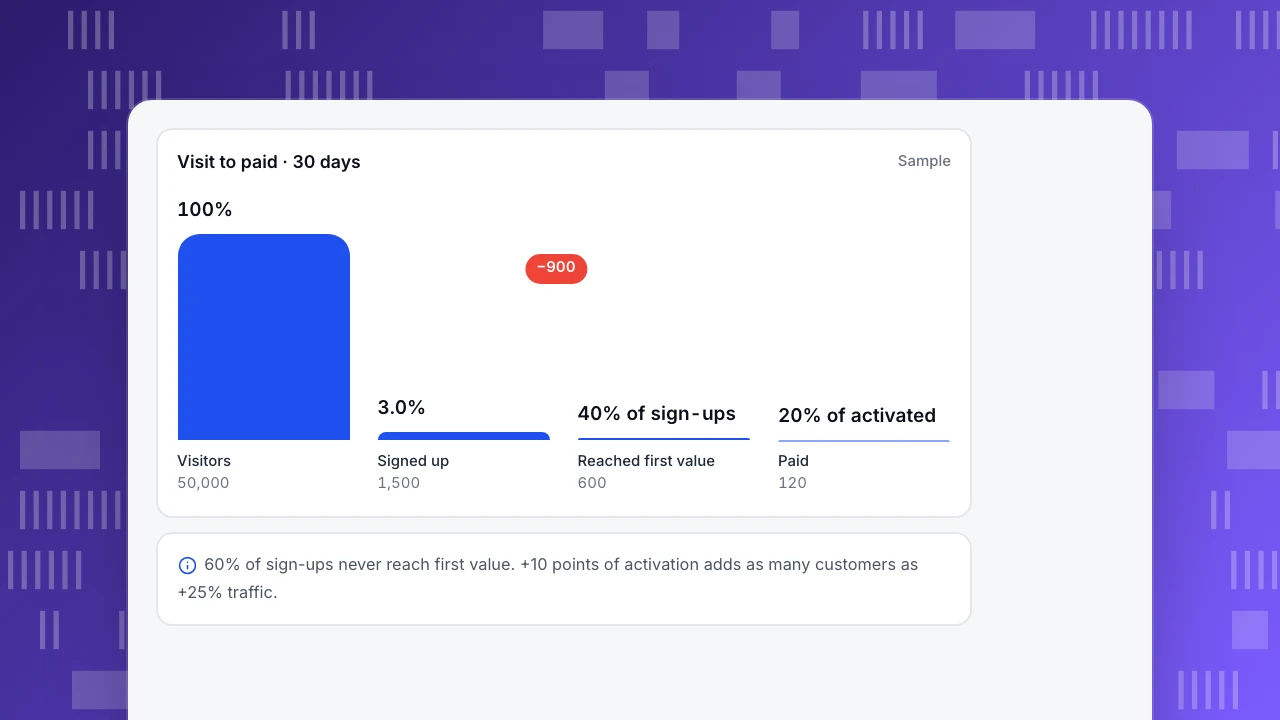
A SaaS product has 50,000 visitors a month (sample numbers). 1,500 sign up (3.0%), 600 reach first value within a week (40% of sign-ups), and 120 pay (20% of those).
More traffic is the tempting fix, but 60% of sign-ups never reach first value. Raising activation from 40% to 50% adds 150 activated users and, at the same 20% paid rate, 30 more customers a month: as much as 25% more traffic would bring. So the team works on activation first. See where to pull first in AARRR.
Visit to paid · 30 days
SampleVisitors
50,000
Signed up
1,500
Reached first value
600
Paid
120
Scoring the backlog
Ideas pile up fast. A simple ICE score (impact, confidence, ease, each 1–10, averaged) gives an order (sample backlog):
| Idea | Impact | Confidence | Ease | ICE |
|---|---|---|---|---|
| Shorter sign-up form (7 → 4 fields) | 7 | 7 | 9 | 7.7 |
| Day-2 onboarding email with one task | 5 | 6 | 8 | 6.3 |
| Pricing page FAQ | 4 | 5 | 9 | 6.0 |
| Referral credit for both sides | 8 | 4 | 4 | 5.3 |
Scores are rough; their job is to stop the loudest idea from always going first.
Metrics for each stage
- Acquisition: visitors and sign-ups by channel, cost per acquisition. See acquisition metrics.
- Activation: share of sign-ups reaching first value, time to value. See onboarding metrics.
- Retention: week-4 or month-3 retention by sign-up cohort.
- Revenue: trial-to-paid rate, ARPA, CAC payback.
- Referral: invites sent, accepted, and the growth loop they feed.
For each test, also ask whether the lift is real or would have happened anyway; see incrementality.
Running it with TapCub
Build the funnel from your own events (visit, sign-up, first key action, payment) in All-platform analytics and read conversion and drop-off per step. Tag campaigns with UTM parameters and compare channels in Web analytics › Sources. Mark each experiment's start and end with an annotation so the change is visible on every trend chart, and set a monitor on the metrics you must not make worse. TapCub does not split traffic for A/B tests; use your testing tool for assignment and TapCub to measure the outcome.
See also
Was this article helpful?
We use your answers to fix and expand this page.
Couldn’t send. Please try again in a minute.
Thanks for the feedback. We’ll use it to improve this page.You’ve already sent feedback on this page. Thanks.

Growth Strategist
Explores acquisition channels, activation, and conversion experiments, turning data insights into actionable growth hypotheses and evaluation methods.