Try it on your own data
Every report in this article is in the free plan. One snippet for web and apps, up to 10 sites.
Start freeAnalyzing data is less about tools and more about order: a clear question, a defined metric, a check of the data, a breakdown of the change, and an explanation you have tried to disprove. This guide gives six steps and works through one example from a sign-up drop to a decision.
What you will learn
- Start from a question tied to a decision, not from a report
- Break every change down by segment until one piece explains most of it
- Test the explanation against the timing and the data before acting
Start with a question, not a dataset
Most analysis goes wrong before any number is looked at. "Let's see what the data says" leads to scrolling through reports. A good question names a decision: "Sign-ups fell last week. Is it a site problem we need to fix, or a traffic change we can explain?"
The six steps
- Write the question and the decision it supports. One sentence each.
- Pick the metric and its definition. Sign-ups counted how: accounts created, or the sign-up goal? Which date range, which time zone?
- Check the data before trusting it. Is tracking still firing on every page? Did a release, a filter or bot traffic change the counts? See data quality.
- Break the change down. Split the metric by the dimensions that could explain it: channel, device, country, landing page, new vs returning.
- Explain it, then test the explanation. Find the cause behind the biggest piece, and look for evidence that would prove you wrong.
- Act and write it down. A decision, an owner and a date to check again.
The table below lists what each step produces.
| Step | Question to answer | Output |
|---|---|---|
| 1. Question | What decision will this inform? | One-sentence question and decision |
| 2. Metric | What exactly do we count, over which period? | Metric definition and date range |
| 3. Check data | Is the tracking complete and clean? | Note on tracking, filters, bots |
| 4. Break down | Which segment holds most of the change? | Change per segment that adds up to the total |
| 5. Explain and test | Why did that segment move, and what would disprove it? | Cause with supporting evidence |
| 6. Act | What do we do, who owns it, when do we check? | Decision, owner, follow-up date |
Steps 3–5 often loop: a breakdown can reveal a data problem.
A worked example: where did 220 sign-ups go?
Weekly sign-ups dropped from 1,240 to 1,020, a fall of 220 (−17.7%). These are sample numbers.
Check the data. Page views and sessions on the sign-up page were steady, and the sign-up goal still fired on test sign-ups. The tracking is fine.
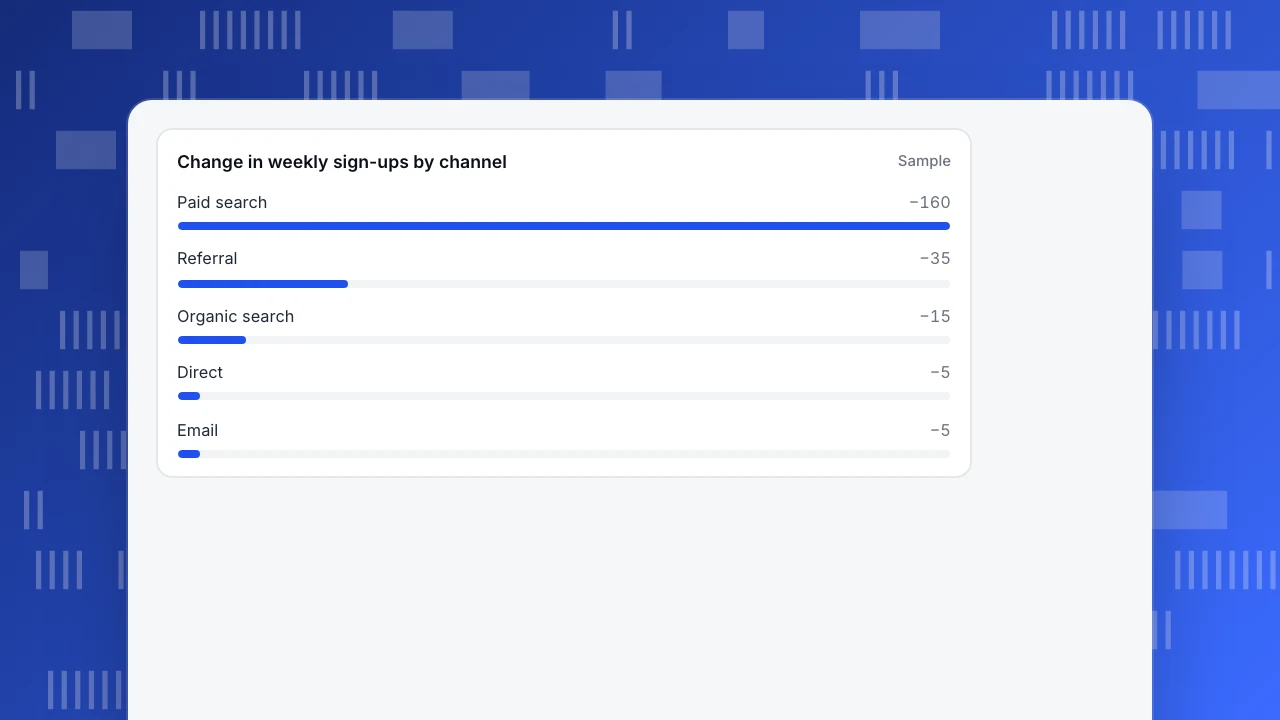
Break it down by channel. The change per channel adds up to the total:
| Channel | Last week | This week | Change |
|---|---|---|---|
| Paid search | 310 | 150 | −160 |
| Referral | 110 | 75 | −35 |
| Organic search | 520 | 505 | −15 |
| Direct | 250 | 245 | −5 |
| 50 | 45 | −5 | |
| Total | 1,240 | 1,020 | −220 |
Paid search explains 160 of the 220 (73%).
Explain and test. Paid search sessions fell from 6,200 to 3,000, while the conversion rate stayed at 5.0% both weeks (310 ÷ 6,200 and 150 ÷ 3,000). So the site converts as before; fewer people arrived. The ad account showed one campaign paused on Tuesday when its budget ran out. Test: sessions from that campaign drop to zero on Tuesday, matching the timing. The referral drop of 35 traces to one partner page that removed its link.
Act. Restore the campaign budget, ask the partner about the link, and add a budget alert. Check again next Monday.
Without the breakdown, the team might have redesigned the sign-up page, which was not the problem.
Change in weekly sign-ups by channel
SampleCommon mistakes
- Only looking at averages. A flat total can hide one segment rising and another falling. Always split.
- Stopping at the first story. Look for evidence against it; see correlation vs causation.
- Comparing unlike periods. Compare a week to the same weekdays, and watch holidays and launches.
- Reading percentages without counts. A 50% drop from 4 to 2 is noise.
- No written conclusion. If it is not written down with a decision, the analysis will be repeated next month.
Doing it in TapCub
- Metric and check: sign-ups as a goal in Web analytics › Goals; the goal's trend and the page's views show whether tracking still works.
- Break down: Web analytics › Sources splits visitors and goals by channel, source and campaign; filters narrow to a device, country or landing page.
- Explain: All-platform analytics gives funnels and behavior analysis by any event property, so you can see whether the drop is at the arrival or the conversion step.
- Write it down: add a date annotation for the paused campaign so the dip is explained the next time someone looks.
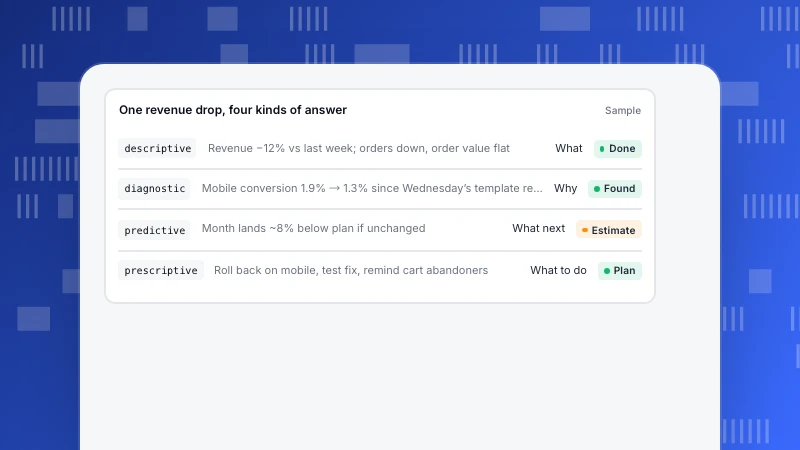
To present the result, see data storytelling. For the kinds of analysis (descriptive, diagnostic, predictive, prescriptive), see types of data analytics.
Was this article helpful?
We use your answers to fix and expand this page.
Couldn’t send. Please try again in a minute.
Thanks for the feedback. We’ll use it to improve this page.You’ve already sent feedback on this page. Thanks.

Product Experience Specialist
Writes about product experience, practical workflows, and growth, turning complex processes into clear steps for everyday decisions.