Try it on your own data
Every report in this article is in the free plan. One snippet for web and apps, up to 10 sites.
Start freeA single conversion rate hides how sure you can be about it. This guide shows how to calculate a confidence interval for a rate, a mean and the difference between two variants, with worked examples on conversion data and fixes for small samples.
What you will learn
- Interval = estimate ± multiplier × standard error; 1.96 for 95%
- For an A/B test, compute the interval of the difference; if it includes zero, the result is not conclusive
- Use the Wilson interval for rates with few conversions and the t value for small means
What a confidence interval tells you
A confidence interval is a range around a measured value that probably contains the true value. "Conversion rate 4.5% (95% CI 3.86% to 5.14%)" says: from this sample, the real long-run rate is plausibly anywhere in that range.
More precisely, if you repeated the measurement many times, 95% of intervals built this way would contain the true value. It does not mean there is a 95% chance that this particular range contains it, but for everyday decisions, "the plausible range" is a fair reading.
The method in four steps
- Compute the estimate: a mean, a rate, or a difference.
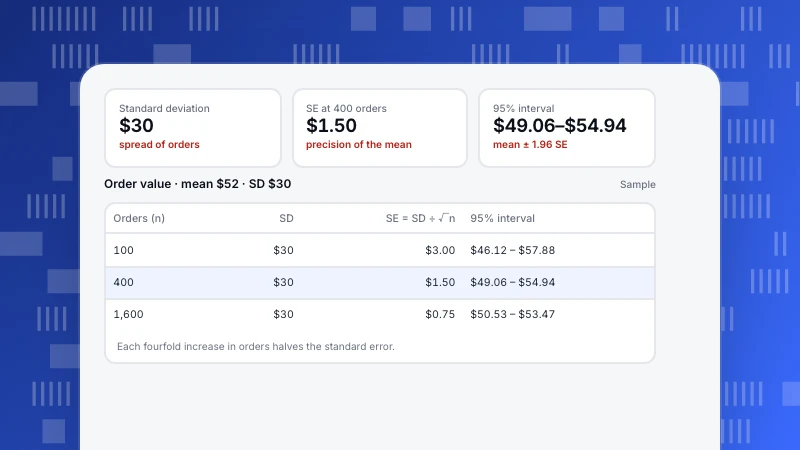
- Compute its standard error (SE). This measures how much the estimate would vary from sample to sample. See standard deviation vs standard error.
- Pick a confidence level and its multiplier: 1.645 for 90%, 1.96 for 95%, 2.576 for 99%.
- Interval = estimate ± multiplier × SE.
Formulas
The table below gives the standard error for the three cases you will meet most often.
| Estimate | Standard error | 95% interval |
|---|---|---|
| Mean | s ÷ √n | mean ± 1.96 × SE (use t for small n) |
| Rate (proportion) | √(p(1 − p) ÷ n) | p ± 1.96 × SE (Wilson for small counts) |
| Difference of two rates | √(p₁(1 − p₁) ÷ n₁ + p₂(1 − p₂) ÷ n₂) | (p₂ − p₁) ± 1.96 × SE |
| Difference of two means | √(s₁² ÷ n₁ + s₂² ÷ n₂) | (m₂ − m₁) ± 1.96 × SE |
Multipliers: 1.645 for 90%, 1.96 for 95%, 2.576 for 99%.
Example: a conversion rate
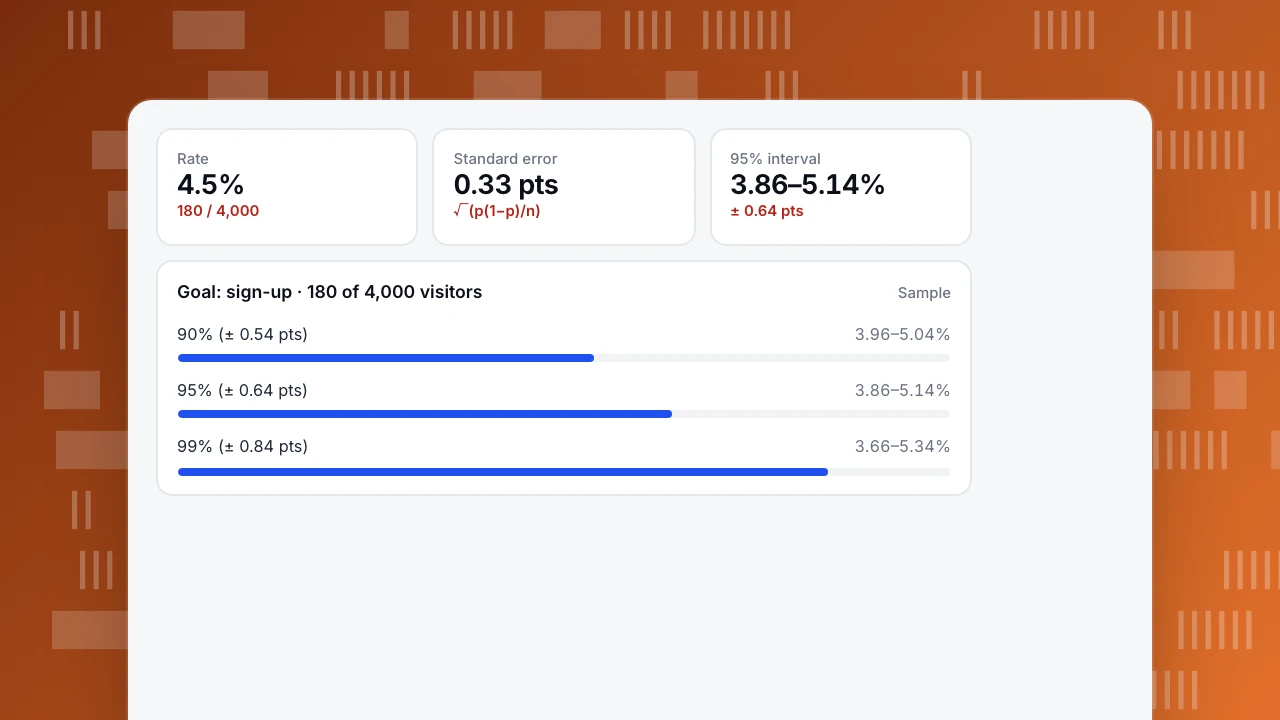
4,000 visitors, 180 conversions (sample numbers).
- Rate p = 180 ÷ 4,000 = 4.5%
- SE = √(0.045 × 0.955 ÷ 4,000) ≈ 0.00328, or 0.328 percentage points
- 95% interval = 4.5% ± 1.96 × 0.328 = 4.5% ± 0.64 points, so 3.86% to 5.14%
A higher confidence level widens the range: 3.96–5.04% at 90%, 3.66–5.34% at 99%.
Rate
4.5%
180 / 4,000
Standard error
0.33 pts
√(p(1−p)/n)
95% interval
3.86–5.14%
± 0.64 pts
Goal: sign-up · 180 of 4,000 visitors
SampleExample: the difference between two variants
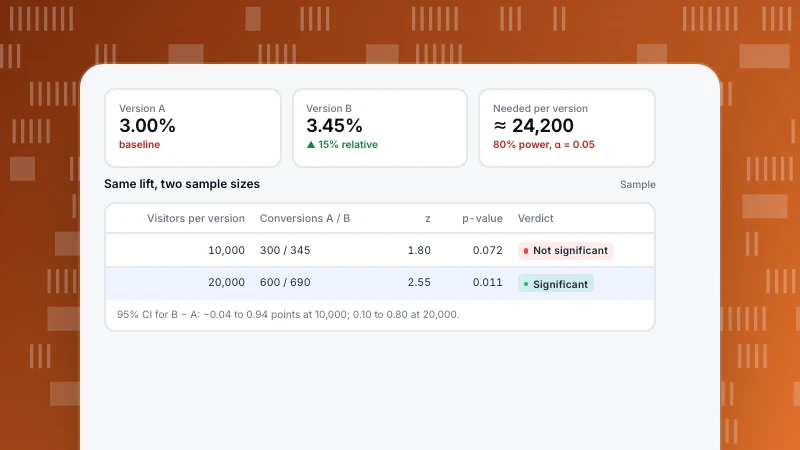
Variant A converts 180 of 4,000 (4.5%); variant B converts 212 of 4,000 (5.3%).
- Difference = 0.8 percentage points
- SE = √(0.045 × 0.955 ÷ 4,000 + 0.053 × 0.947 ÷ 4,000) ≈ 0.483 points
- 95% interval = 0.8 ± 1.96 × 0.483, so −0.15 to +1.75 points
The interval includes zero, so the data is consistent with no real difference. B may well be better, but this sample cannot rule out that it is not. That matches a two-sided test at the 5% level not being significant; see statistical significance.
Small samples
- Rates with few conversions. With 3 conversions in 40 visitors (7.5%), the simple formula gives −0.66% to 15.66%: a negative rate is impossible. Use the Wilson interval instead, which gives about 2.58% to 19.86%. Most statistics libraries and online calculators offer it.
- Means from small samples. Use the t distribution instead of 1.96. For 25 sessions with a mean of 12.4 minutes and a standard deviation of 6.0, SE = 6.0 ÷ 5 = 1.2, t = 2.064, so the 95% interval is 9.92 to 14.88 minutes.
How to read and report intervals
- Width matters as much as the centre. "4.5% ± 0.64" and "4.5% ± 3" are very different findings.
- Overlapping intervals do not prove "no difference". Compute the interval of the difference directly, as above.
- Report the level. Always say 90%, 95% or 99%.
- Intervals only cover sampling noise. Bot traffic, broken tracking or a holiday week are not inside the ± range.
To plan how many visitors you need for a narrow enough interval, see minimum detectable effect.
Getting the counts from TapCub
For a rate you need two numbers: conversions and the base. Take them from Web analytics › Goals (conversions and visitors for a goal) or from the step counts of a funnel in All-platform analytics. Use the same date range and filters for both variants. For a mean, use All-platform analytics › Behavior › Behavior analysis with an average aggregation on the property. Then apply the formulas above.
See also: Central limit theorem.
Was this article helpful?
We use your answers to fix and expand this page.
Couldn’t send. Please try again in a minute.
Thanks for the feedback. We’ll use it to improve this page.You’ve already sent feedback on this page. Thanks.

Product Analyst
Focuses on event analysis, conversion funnels, and retention, using clear metric definitions and structured analysis to explain product performance.