Try it on your own data
Every report in this article is in the free plan. One snippet for web and apps, up to 10 sites.
Start freeData storytelling is presenting data so that the audience understands what happened, why it matters and what to do next. It is not decoration. A report full of accurate charts can still leave people unsure what to decide. This guide gives a five-part structure you can reuse for any report, shows one analysis told badly and well, and covers how to keep the story honest.
What you will learn
- Lead with the answer, then the evidence, then the action
- One chart, one point: the title should say the finding, not the metric name
- Show what would change your mind, and label samples and uncertainty
What data storytelling is
Data storytelling is the practice of explaining data in a way that leads to understanding and a decision. It combines three things:
- Data: accurate numbers, with their definitions.
- Visuals: charts that make the main point easy to see.
- Narrative: the sentences that say what it means and what to do.
Without the narrative, people see charts and draw their own, often different, conclusions.
A five-part structure
The table gives a structure that works for a weekly email, a monthly review or a slide. The key is the order: the answer comes second, right after the question, not at the end after twelve charts.
| Part | What it says | Example |
|---|---|---|
| 1. Question | What we wanted to know | Why did sign-ups fall in October? |
| 2. Answer | The finding in one sentence | Mobile sign-ups fell after the new form launched |
| 3. Evidence | One or two charts that prove it | Sign-up rate by device, before and after 3 Oct |
| 4. Cause | Why it happened, with how sure we are | The form hides the submit button on small screens; confirmed in replays |
| 5. Action | What to do, who, by when | Fix the layout this sprint; re-check in two weeks |
The same five parts work for a slide, an email or a dashboard text block.
Before and after
Before. A monthly report has twelve charts: sessions, sign-ups, bounce rate, sources, devices, top pages and more. Sign-ups are down 18%. The report says "sign-ups declined in October" and moves on. Readers argue in the meeting about whether it was the season, a campaign or a bug.
After. The same data, told with the five parts:
- Question: why did sign-ups fall 18% in October?
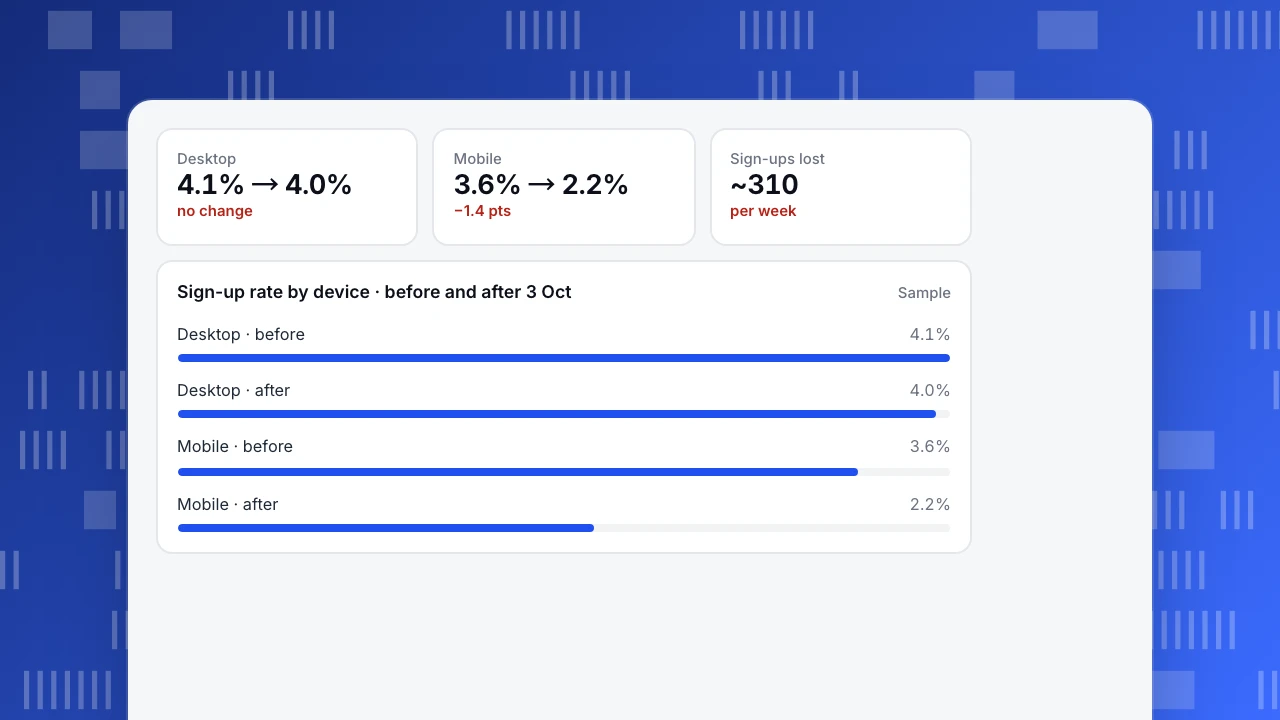
- Answer: mobile sign-ups fell after the new form launched on 3 October; desktop did not change.
- Evidence: one chart of sign-up rate by device, before and after 3 October.
- Cause: on small screens the submit button sits below the keyboard; session replays confirm people giving up there.
- Action: fix the layout this sprint; re-check in two weeks.
The meeting takes five minutes, and the fix ships that week.
Desktop
4.1% → 4.0%
no change
Mobile
3.6% → 2.2%
−1.4 pts
Sign-ups lost
~310
per week
Sign-up rate by device · before and after 3 Oct
SampleChoosing charts
- Change over time: a line chart. Add an annotation on the date something changed.
- Comparison between groups: a bar chart, sorted.
- Parts of a whole: a stacked bar or a simple table; avoid pie charts with many slices.
- Steps in a process: a funnel.
- Title with the finding: "Only mobile sign-ups fell" rather than "Sign-up rate by device".
Keeping it honest
- Show the denominator and the time range.
- Label samples and small numbers. A change on 40 sessions is not a finding.
- Say how sure you are. "Confirmed in replays" is stronger than "likely".
- Do not hide inconvenient data. If one segment goes the other way, say so.
- Separate correlation from cause. See correlation vs causation.
Making it a habit
Build each team's dashboard with a short text block at the top that answers the main question for the period, and annotate charts with releases and campaigns. Shared definitions make stories comparable from month to month; see data democratization.
FAQ
What is an example of data storytelling?
A short report that asks why sign-ups fell, answers in one sentence, shows one chart that proves it, explains the cause and ends with an action and owner.
What are the key elements of data storytelling?
Data, visuals and narrative. The narrative is what turns the first two into a decision.
How long should a data story be?
As short as the decision allows. Often one paragraph and one or two charts are enough.
See also: What is data visualization? Chart types, principles and examples.
Was this article helpful?
We use your answers to fix and expand this page.
Couldn’t send. Please try again in a minute.
Thanks for the feedback. We’ll use it to improve this page.You’ve already sent feedback on this page. Thanks.

Product Experience Specialist
Writes about product experience, practical workflows, and growth, turning complex processes into clear steps for everyday decisions.