Try it on your own data
Every report in this article is in the free plan. One snippet for web and apps, up to 10 sites.
Start freeProduct-market fit means a clear group of people needs your product enough to keep using it, pay for it and tell others. No single number proves it, but six signals together come close. This guide groups them into behaviour and survey signals, explains how to read each, and works through a sample where they disagree.
What you will learn
- The strongest behavioural signal is a retention curve that flattens above zero
- Read behaviour and survey signals together; behaviour wins when they disagree
- Measure fit for one segment at a time; fit in one group is often hidden by the average
What product-market fit looks like in data
Product-market fit is when a specific group of people needs your product enough to keep using it without being pushed. In data it shows up as people who keep coming back, new users who arrive without paid acquisition, and customers who are upset at the idea of losing the product.
No single metric proves it. Several signals pointing the same way do.
Six signals
The table lists six signals, how to measure each and what suggests fit. They fall into two groups:
- Behaviour: retention, repeat use, organic growth, referral, willingness to pay.
- Survey: the "very disappointed" question: how would you feel if you could no longer use this product?
| Signal | How to measure | What suggests fit |
|---|---|---|
| Retention curve | Share of each cohort still active over time | Flattens at a stable level instead of falling to zero |
| Repeat use | Active days per user per week or month | Steady or rising for the core segment |
| Organic growth | Share of new users from direct, search and referral | Growing without more spend |
| Survey: "very disappointed" | Share who would be very disappointed without the product | A large share; 40% is a widely used rule of thumb |
| Willingness to pay | Trial-to-paid rate, price objections | Conversion holds when price rises |
| Referral | Share of new users referred by existing ones | Rising over time |
Rules of thumb, not pass marks. Compare with your own trend.
The most important one: a flattening curve
Plot the share of each sign-up cohort still active week by week. Without fit, the curve keeps falling towards zero. With fit, it falls at first and then flattens: a stable core keeps using the product. Use the "returned in period N or later" view, which never rises, to see the floor clearly. See what is a good retention rate.
A worked example
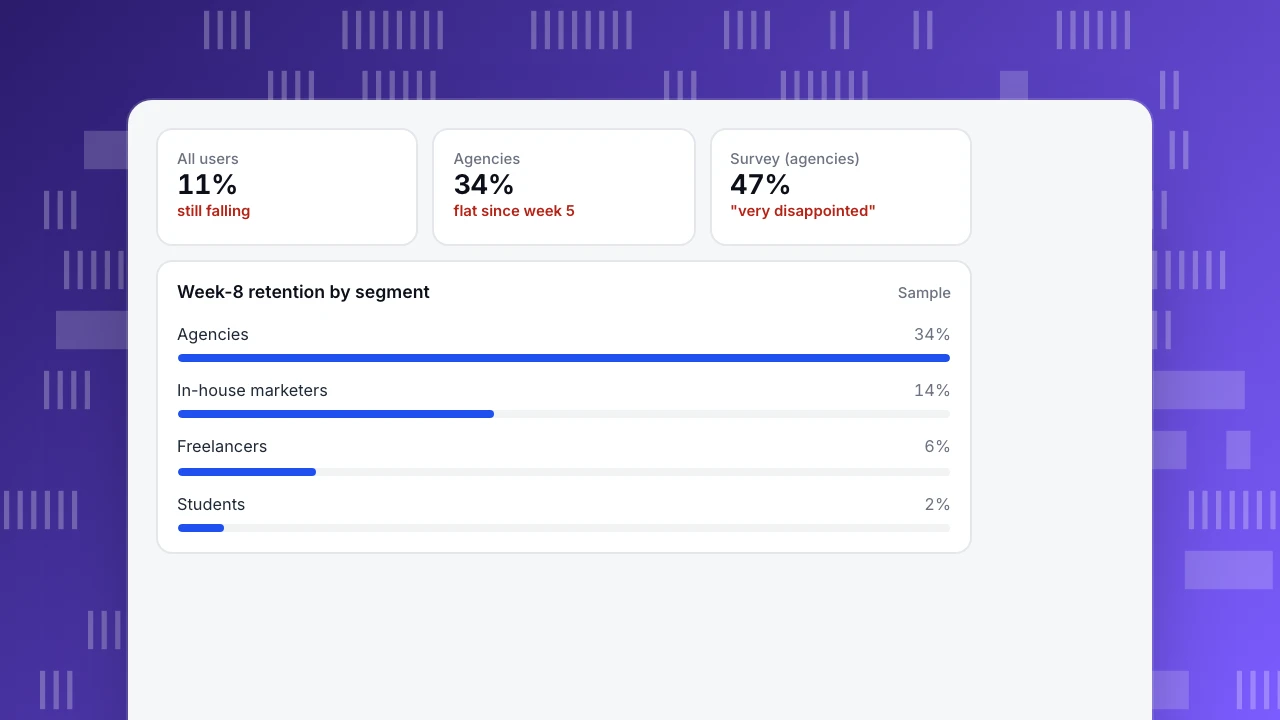
A scheduling tool for marketers sees week-8 retention of 11% across all users, still falling. The founders are close to concluding there is no fit. Splitting by segment changes the picture:
- Agencies: 34%, flat since week 5.
- In-house marketers: 14%, slowly falling.
- Freelancers and students: under 10% and falling.
A survey of active agency users finds 47% would be very disappointed without the product. Organic sign-ups from agencies are also rising. The team has fit with agencies, hidden by the average. They narrow positioning and onboarding to agencies.
All users
11%
still falling
Agencies
34%
flat since week 5
Survey (agencies)
47%
"very disappointed"
Week-8 retention by segment
SampleWhen signals disagree
- Good survey, weak retention: people like the idea but do not use it. Trust behaviour; look at onboarding and frequency.
- Strong retention, weak growth: fit with a group you are not reaching. Look at channels and referral.
- Growth from paid only: acquisition is buying users who do not stay. Check retention by channel.
A checklist
- Do any segments have a retention curve that flattens?
- Is that segment's repeat use steady?
- Are new users from that segment arriving without paid spend?
- Would a large share of them be very disappointed without the product?
- Do they pay, and keep paying?
If most answers are yes for one segment, focus on it. More in startup metrics.
FAQ
How do you measure product-market fit?
Combine behaviour (retention curve, repeat use, organic growth) with a survey asking how disappointed people would be without the product.
What is the 40% rule?
A widely used rule of thumb: if around 40% or more of active users say they would be very disappointed without the product, that suggests fit. Treat it as a guide, not a test you pass or fail.
Can you lose product-market fit?
Yes. Markets change, competitors arrive and needs shift. Keep watching the retention floor for new cohorts.
Was this article helpful?
We use your answers to fix and expand this page.
Couldn’t send. Please try again in a minute.
Thanks for the feedback. We’ll use it to improve this page.You’ve already sent feedback on this page. Thanks.

Data Engineer
Writes about event design, data quality, and collection workflows, with verifiable implementation methods for reliable analytics.