Try it on your own data
Every report in this article is in the free plan. One snippet for web and apps, up to 10 sites.
Start freeMost product strategy documents are either a feature list or a set of ambitions. A real strategy makes choices: who you serve, which obstacle you attack, how you will win and what you will not do. This guide compares five frameworks, gives a one-page template, and fills it in for an example company.
What you will learn
- A strategy is a diagnosis, a guiding policy and coherent bets, not a feature list or a revenue goal
- Tie it to one metric with a target and date, and write explicit non-goals
- Test it: would a competitor write the same thing, and would your team decide differently because of it?
What a product strategy is
A product strategy is a short explanation of how the product will win: for whom, against what problem, with what approach, and what you will deliberately not do. It sits between the vision (where you want to be in years) and the roadmap (what you build next).
It is not:
- A list of features. That is a roadmap.
- A set of goals. "Grow revenue 50%" is an ambition; the strategy is how.
- Everything at once. A strategy that says yes to every segment and feature makes no choices.
Five well-known frameworks
The table below compares five frameworks that product teams use. They overlap; pick one that your team will actually fill in.
| Framework | Core idea | Best for |
|---|---|---|
| Strategy kernel (Rumelt) | Diagnosis, guiding policy, coherent actions | Testing whether a strategy makes real choices |
| Playing to Win (Lafley and Martin) | Five questions from winning aspiration to management systems | Company-level or multi-product strategy |
| DHM (Gibson Biddle) | Delight customers in hard-to-copy, margin-enhancing ways | Choosing between strategic bets |
| Product Vision Board (Pichler) | Vision, target group, needs, product, business goals on one board | Early products and team alignment |
| Opportunity Solution Tree (Torres) | Outcome, then opportunities, solutions and experiments | Linking strategy to continuous discovery |
They overlap; the one-page template below borrows from the first and last.
A one-page template
Most frameworks reduce to five parts. Fill each in a few sentences:
- Diagnosis: what is really going on? The main obstacle, backed by data.
- Guiding policy: the approach you choose to deal with it, and where you will play.
- Bets: three to five coherent actions that follow from the policy.
- Metric: one number that shows whether the strategy works, with a target and date.
- Non-goals: what you will not do, even if asked.
A filled-in example
A scheduling app for small clinics (sample company and numbers):
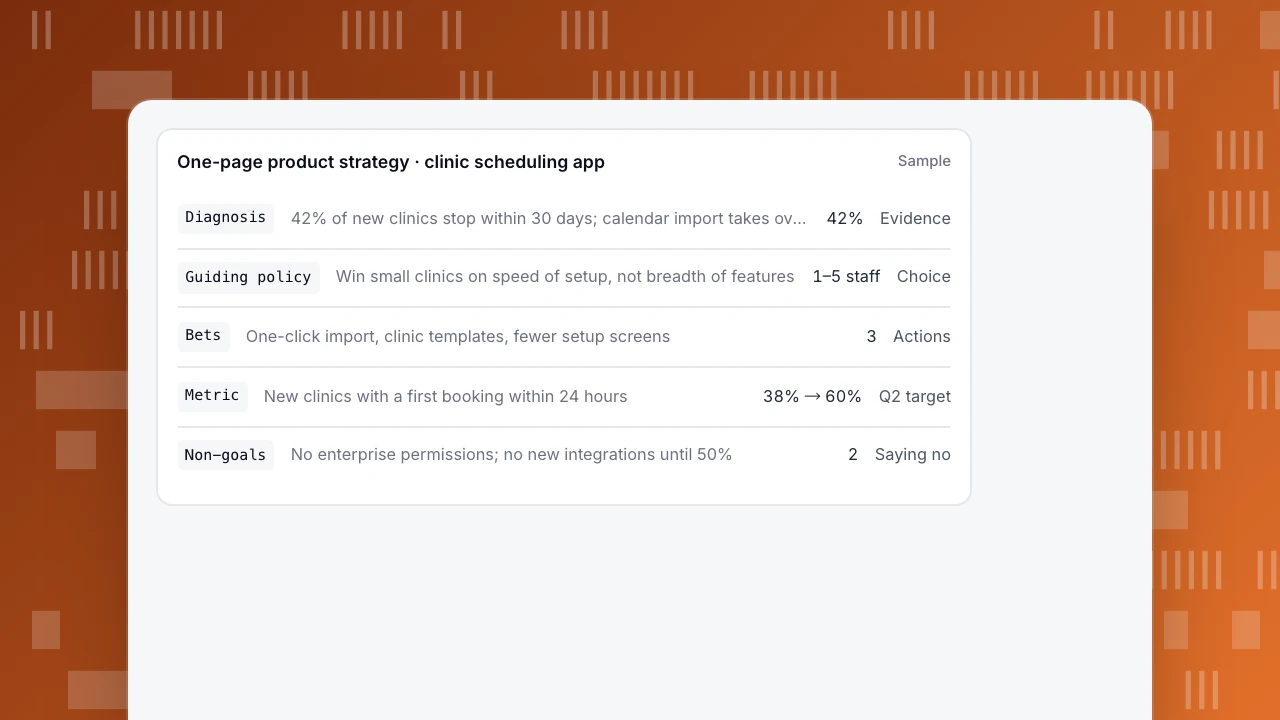
Diagnosis. 42% of new clinics stop using the app within 30 days. Interviews and product data agree: importing existing calendars takes over an hour, and clinics that do not get a first booking in the first day rarely come back.
Guiding policy. Win small clinics (1–5 practitioners) on speed of setup, not on breadth of features. Large clinic groups are not the focus this year.
Bets.
- One-click import from the three most used calendar tools.
- Ready-made templates for the five most common clinic types.
- Remove two settings screens from the first-run flow; defaults instead.
Metric. Share of new clinics with a first patient booking within 24 hours: 38% today, 60% by the end of Q2. Secondary: 30-day retention of new clinics.
Non-goals. No multi-location or enterprise permissions this year. No new integrations beyond calendars until the metric reaches 50%.
Note how the bets follow from the diagnosis, and the non-goals free the team to say no.
One-page product strategy · clinic scheduling app
SampleDiagnosis42% of new clinics stop within 30 days; calendar import takes over an hour42%EvidenceGuiding policyWin small clinics on speed of setup, not breadth of features1–5 staffChoiceBetsOne-click import, clinic templates, fewer setup screens3ActionsMetricNew clinics with a first booking within 24 hours38% → 60%Q2 targetNon-goalsNo enterprise permissions; no new integrations until 50%2Saying no
Is it a good strategy?
- Does it make a choice? If a competitor could adopt it word for word, it is too generic.
- Is the diagnosis based on evidence? Data and customer stories, not opinions. See product discovery.
- Do the bets fit together? Each should make the others stronger.
- Can you tell in three months whether it is working? If not, the metric is wrong.
- Would the team decide differently because of it? If not, it is decoration.
Tracking it in TapCub
Define the metric as events: "clinic_created" and "booking_created". In All-platform analytics › Behavior › Behavior analysis, a funnel with a 24-hour window gives the share of new accounts that book within a day, and the retention model shows 30-day retention by signup week. Put both on a board in All-platform analytics › Overview › My dashboards and add annotations when each bet ships, so the monthly review shows which bet moved the number. To test bets before committing, see product validation; to set targets, see OKR vs KPI and the north star metric.
Was this article helpful?
We use your answers to fix and expand this page.
Couldn’t send. Please try again in a minute.
Thanks for the feedback. We’ll use it to improve this page.You’ve already sent feedback on this page. Thanks.

Product Adoption Consultant
Explores customer onboarding, live conversations, and self-service, turning common usage questions into practical guidance and improvements.