Try it on your own data
Every report in this article is in the free plan. One snippet for web and apps, up to 10 sites.
Start freeOKRs and KPIs are often treated as rivals. They answer different questions: KPIs tell you whether things are healthy, OKRs set what you are changing this quarter. This guide explains the difference, shows how one feeds the other with a worked example, and lists the common mistakes.
What you will learn
- KPIs are ongoing health measures; OKRs are time-bound goals for change
- A KPI outside its healthy range is a good candidate for an OKR
- Write key results with a baseline, a target and a data source, and keep other KPIs as guardrails
The short answer
A KPI (key performance indicator) is a number you watch all the time to know whether something is healthy: conversion rate, churn, uptime. An OKR (objective and key results) is a goal for a fixed period, usually a quarter: a qualitative objective plus three to five measurable key results that show you got there.
KPIs say "how are we doing?". OKRs say "what are we changing?". Most teams need both.
The difference
The table below compares them side by side.
| KPI | OKR | |
|---|---|---|
| Purpose | Monitor health | Drive a specific change |
| Time frame | Ongoing | Fixed, usually a quarter |
| Form | A metric with a healthy range | An objective plus 3–5 measurable key results |
| Example | Trial-to-paid conversion 20–25% | Make first reports effortless: activation 40% → 50% |
| When it changes | Rarely; when the business changes | Every cycle |
| If missed | Investigate, maybe set an OKR | Learn and reset; 70% can be a good result |
Many key results are KPIs with a target attached; the rest of your KPIs become guardrails.
How they work together
Think of KPIs as the dashboard of a car and OKRs as the route for this trip.
- KPIs set the baseline. Each KPI has a healthy range.
- A KPI outside its range becomes a candidate OKR. If trial-to-paid drops below target, improving it might become this quarter's objective.
- Key results are often KPIs with a target. "Raise activation from 40% to 50%" turns an ongoing number into a quarterly goal.
- Other KPIs act as guardrails. While you push one number, the rest must stay in range. See guardrail metrics.
- After the quarter, the improved number goes back to being a KPI with a new, higher range.
A worked example: an onboarding team
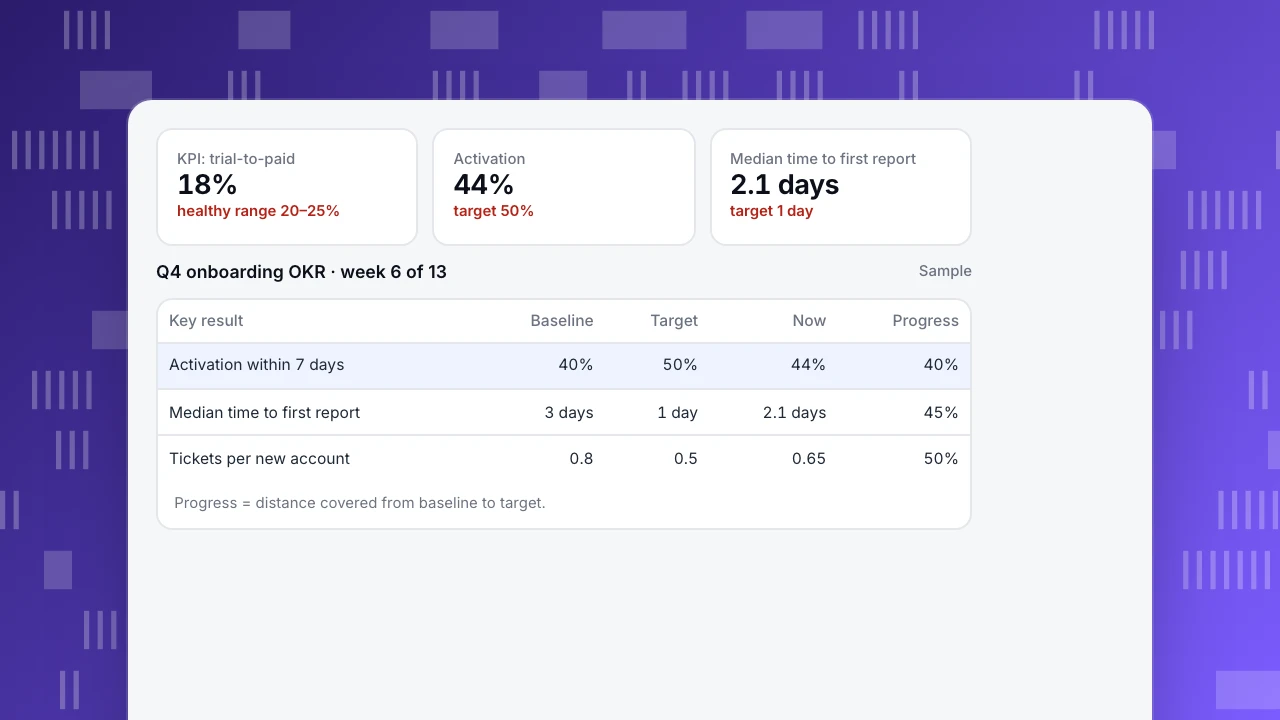
A SaaS team watches trial-to-paid conversion as a KPI. Its healthy range is 20–25%; last quarter it was 18% (sample numbers). Digging in, the team finds most trials never reach the first report.
Objective: Make it effortless for new accounts to see their first useful report.
Key results:
- Raise activation (trials that create a first report within 7 days) from 40% to 50%
- Cut the median time to the first report from 3 days to 1 day
- Reduce support tickets per new account from 0.8 to 0.5
Guardrail KPIs: trial sign-ups and page load time stay within range.
Each key result has a baseline, a target and a data source. "Improve onboarding" would not.
KPI: trial-to-paid
18%
healthy range 20–25%
Activation
44%
target 50%
Median time to first report
2.1 days
target 1 day
Q4 onboarding OKR · week 6 of 13
Sample| Key result | Baseline | Target | Now | Progress |
|---|---|---|---|---|
| Activation within 7 days | 40% | 50% | 44% | 40% |
| Median time to first report | 3 days | 1 day | 2.1 days | 45% |
| Tickets per new account | 0.8 | 0.5 | 0.65 | 50% |
Progress = distance covered from baseline to target.
Writing key results you can measure
- Start from a baseline. "From 40% to 50%", not "to 50%".
- Measure outcomes, not tasks. "Ship a new checklist" is a task; "activation rises to 50%" is a result.
- Define the metric once. Same event, same window, same filters every week.
- Mix leading and lagging indicators. Activation moves within weeks; revenue may lag a quarter.
- Keep it to three to five. More than that and none get attention.
Common mistakes
- Turning every KPI into an OKR. OKRs are for change; most KPIs just need watching.
- Business-as-usual OKRs. "Keep uptime at 99.9%" is a KPI, not an objective.
- Tying OKRs to bonuses. People then set safe targets. Many teams treat 70% achievement as a good result.
- No owner for the data. If nobody can produce the number on Monday, the key result is not measurable yet. See actionable metrics.
Tracking both in TapCub
Define each KPI and key result once as a custom metric in All-platform analytics › Behavior › Metrics & SQL (for example "trials with a first report in 7 days ÷ trials"), so every chart uses the same definition. Put them on a dashboard in All-platform analytics › Overview › My dashboards, with the KPIs on top and this quarter's key results below. Set a monitor on each guardrail KPI so you hear about it when it leaves its range, and annotate the date each initiative ships.
See also
Was this article helpful?
We use your answers to fix and expand this page.
Couldn’t send. Please try again in a minute.
Thanks for the feedback. We’ll use it to improve this page.You’ve already sent feedback on this page. Thanks.

Data Engineer
Writes about event design, data quality, and collection workflows, with verifiable implementation methods for reliable analytics.