Try it on your own data
Every report in this article is in the free plan. One snippet for web and apps, up to 10 sites.
Start freeDesign reviews often end in opinions. UX metrics replace them with numbers: whether people complete the task, how long it takes, how many mistakes they make and how it feels. This guide lists the useful metrics, explains Google’s HEART framework, and walks through a checkout redesign measured with both behavior and survey data.
What you will learn
- Combine behavioral metrics with attitudinal ones
- Task success, time on task and errors show whether a design works
- A SUS score around 68 is average
- Use HEART to pick goals, signals and metrics per project
- Set a baseline before launch and test significance
What are UX metrics?
UX metrics are quantitative measures of how well a product's user experience works: whether people can complete tasks, how long it takes, how many mistakes they make, how they feel about it, and whether they keep using it. They let design teams compare versions, set targets and show the effect of design work in numbers rather than opinions.
UX metrics fall into two families:
- Behavioral metrics measure what people do: task success, time on task, errors, abandonment, frustration clicks.
- Attitudinal metrics measure what people say: satisfaction, perceived ease, likelihood to recommend.
Both are needed. Users who succeed slowly and grudgingly may still churn; users who say they love a feature but never use it are not evidence of value.
The most useful UX metrics
| Metric | Type | How to measure | What it tells you |
|---|---|---|---|
| Task success rate | Behavioral | Share of users who complete a defined task | Whether the design works at all |
| Time on task | Behavioral | Median time to complete the task | Efficiency |
| Error rate | Behavioral | Errors (wrong path, validation error) per task attempt | Where the design misleads |
| Abandonment rate | Behavioral | Share who start a flow and leave before the end | Where friction is highest |
| Rage and error clicks | Behavioral | Repeated rapid clicks; clicks followed by a script error | Frustration in live traffic |
| System Usability Scale (SUS) | Attitudinal | 10-item questionnaire, scored 0–100 | Overall perceived usability |
| Single Ease Question (SEQ) | Attitudinal | "How easy was this task?" 1–7 after a task | Perceived difficulty of one task |
| CSAT | Attitudinal | Satisfaction rating after an interaction | Satisfaction with a moment |
| Net Promoter Score (NPS) | Attitudinal | Likelihood to recommend, 0–10 | Overall loyalty, not usability |
| Adoption and retention | Behavioral | Share using a feature; share returning | Whether the experience creates lasting value |
On SUS, a score of about 68 is the commonly cited average across many studies, so a score above 68 is above average and one below it signals usability problems.
Frameworks: Google HEART and goals–signals–metrics
Google researchers Kerry Rodden, Hilary Hutchinson and Xin Fu proposed the HEART framework for measuring user experience at scale:
| Dimension | Question | Example metric |
|---|---|---|
| Happiness | Do users like it? | SUS, CSAT, satisfaction surveys |
| Engagement | How much do they use it? | Sessions per week, actions per session |
| Adoption | Do new users or features get picked up? | Share of new users using a feature in week 1 |
| Retention | Do users come back? | Share active again after 30 days |
| Task success | Can they do what they came to do? | Completion rate, time on task, errors |
For each dimension you choose a goal (what the experience should achieve), the signals that show progress, and the metrics that turn signals into numbers. Not every project needs all five dimensions; a checkout redesign might focus on task success and happiness, a new feature on adoption and retention.
| HEART | Example metric |
|---|---|
| Happiness | SUS, CSAT |
| Engagement | Sessions per week |
| Adoption | Feature use in week 1 |
| Retention | Active again after 30 days |
| Task success | Completion, time, errors |
Pick a goal, signals and metrics for each dimension you use.
Worked example: measuring a checkout redesign
An online store redesigned its checkout: one page instead of three, address autocomplete and clearer error messages. The team defined HEART metrics before launch and compared four weeks before and after (sample figures):
| HEART dimension | Metric | Before | After |
|---|---|---|---|
| Task success | Checkout completion (started → paid) | 58% | 64% |
| Task success | Usability test success, 10 participants | 7 of 10 | 9 of 10 |
| Task success | Median time to complete | 3 min 40 s | 2 min 50 s |
| Task success | Form validation errors per checkout | 1.4 | 0.6 |
| Happiness | SUS, post-test | 62 | 74 |
| Happiness | Rage clicks per 1,000 checkout sessions | 14 | 5 |
| Retention | Repeat purchase within 60 days | 21% | 22% |
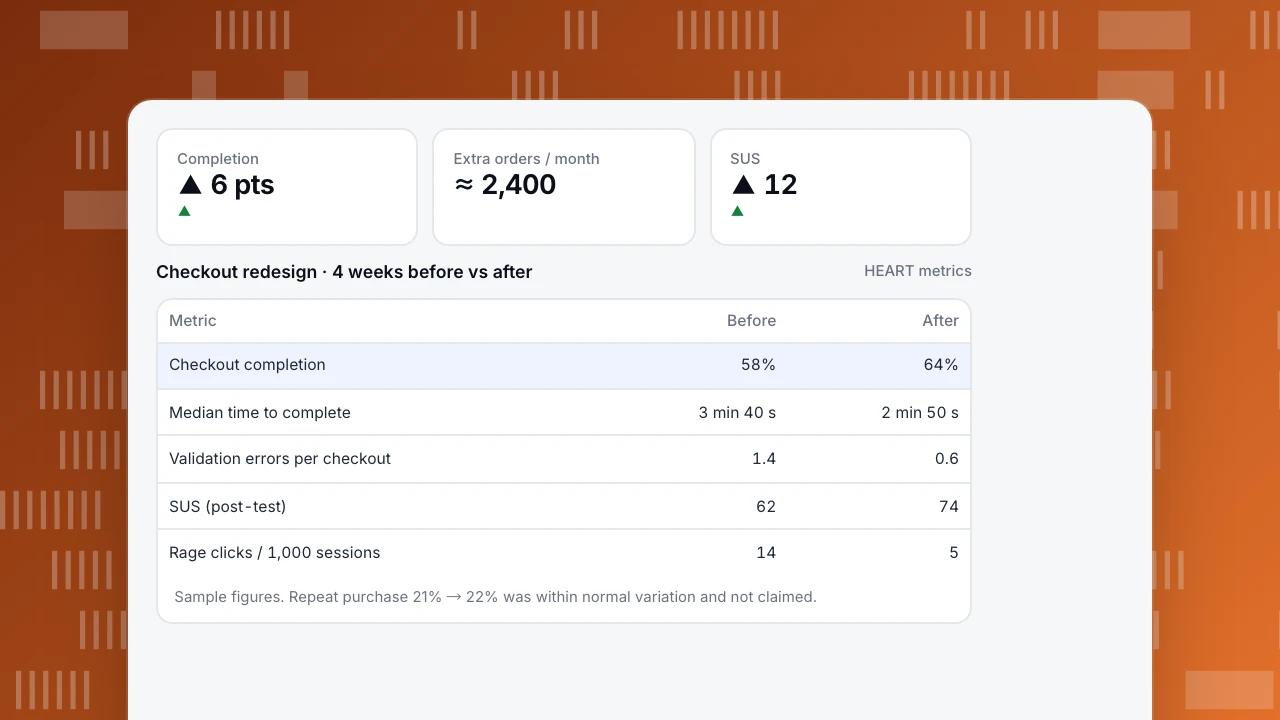
The completion lift of 6 points on 40,000 checkout starts a month means about 2,400 more orders. The team was careful about what not to claim: the repeat-purchase change (21% → 22%) was within normal month-to-month variation, so it was reported as "no detectable change," not as a win.
The behavioral data also found one problem the usability test had missed: rage clicks clustered on the "Apply discount" link, which collapsed the field instead of opening it on some Android browsers. It was fixed in the following week.
Completion
▲ 6 pts
▲
Extra orders / month
≈ 2,400
SUS
▲ 12
▲
Checkout redesign · 4 weeks before vs after
HEART metrics| Metric | Before | After |
|---|---|---|
| Checkout completion | 58% | 64% |
| Median time to complete | 3 min 40 s | 2 min 50 s |
| Validation errors per checkout | 1.4 | 0.6 |
| SUS (post-test) | 62 | 74 |
| Rage clicks / 1,000 sessions | 14 | 5 |
Sample figures. Repeat purchase 21% → 22% was within normal variation and not claimed.
How to choose UX metrics
- Start from the user goal of the flow you are changing, not from the metrics available.
- Pick one primary metric per project and two or three supporting ones.
- Combine behavioral and attitudinal measures: one tells you what happened, the other how it felt.
- Add a guardrail that should not get worse, such as error rate or support tickets.
- Set the baseline before you ship and agree on what change would count as success.
- Check significance before claiming small differences, especially on small usability tests.
Common mistakes
- Using NPS as a usability metric. It measures loyalty, which depends on price, support and brand too.
- Reporting averages for time on task. Times are skewed; use the median.
- Ten-person tests as precise numbers. 7 of 10 vs 9 of 10 is a signal, not a precise rate.
- Measuring after launch only. Without a baseline there is no comparison.
- Too many metrics. A dashboard with 30 UX metrics leads to none being acted on.
Measuring UX in TapCub
TapCub covers the behavioral side from live traffic. Funnels give completion and drop-off for any flow (Build a funnel, Read funnel drop-off). Monitoring › Errors lists rage clicks (at least 3 clicks on the same element within 500 ms) and error clicks (a script error within 1 second of a click) per page. Heatmaps show where people click and scroll (Create a heatmap), and form tracking shows which fields cause abandonment (Track form submissions). Collect attitudinal scores such as SUS or CSAT with your survey tool and send them as event properties to compare them with behavior. Related reading: UX analytics, User friction and How to read a heatmap.
See also: Dead clicks.
See also: UX audit, UX optimization.
See also: What is product experience (PX)? Definition, metrics and examples.
Sources
- Rodden, Hutchinson and Fu, Measuring the user experience on a large scale: user-centered metrics for web applications (Google, CHI 2010).
- MeasuringU, Measuring usability with the System Usability Scale (SUS).
Was this article helpful?
We use your answers to fix and expand this page.
Couldn’t send. Please try again in a minute.
Thanks for the feedback. We’ll use it to improve this page.You’ve already sent feedback on this page. Thanks.

Product Adoption Consultant
Explores customer onboarding, live conversations, and self-service, turning common usage questions into practical guidance and improvements.