Try it on your own data
Every report in this article is in the free plan. One snippet for web and apps, up to 10 sites.
Start freeUser friction is anything that makes a task harder than it needs to be: a button that does not respond, a form that rejects input without saying why, a step that sends people in circles. Some friction is deliberate, like confirming a deletion. Most is accidental, and it leaves traces in behaviour data. This guide covers the signals that reveal it, a worked example and how to decide what to fix first.
What you will learn
- Friction leaves traces: rage clicks, error clicks, form drop-off, loops and slow pages
- Rank friction points by how many people hit them and how close they are to a conversion
- Confirm with a few session replays before changing the design
What user friction is
Friction is the gap between how easy a task should be and how hard it is. It shows up as hesitation, repeated attempts, detours or giving up. A little deliberate friction can protect people, such as a confirmation before deleting data. Accidental friction just costs you users.
Typical sources are unclear labels, elements that look clickable but are not, slow responses, forms with strict or hidden rules, and steps that ask for information at the wrong time.
Signals in your data
You rarely see friction directly; you see what people do when they hit it. The table lists the common signals and how to measure them.
Two of them have precise definitions in TapCub:
- Rage clicks. On heatmaps, a rage click is recorded on the third click within 300 ms and 50 pixels. The errors report counts three or more clicks on the same element within 500 ms.
- Error clicks. Clicks followed by a script error.
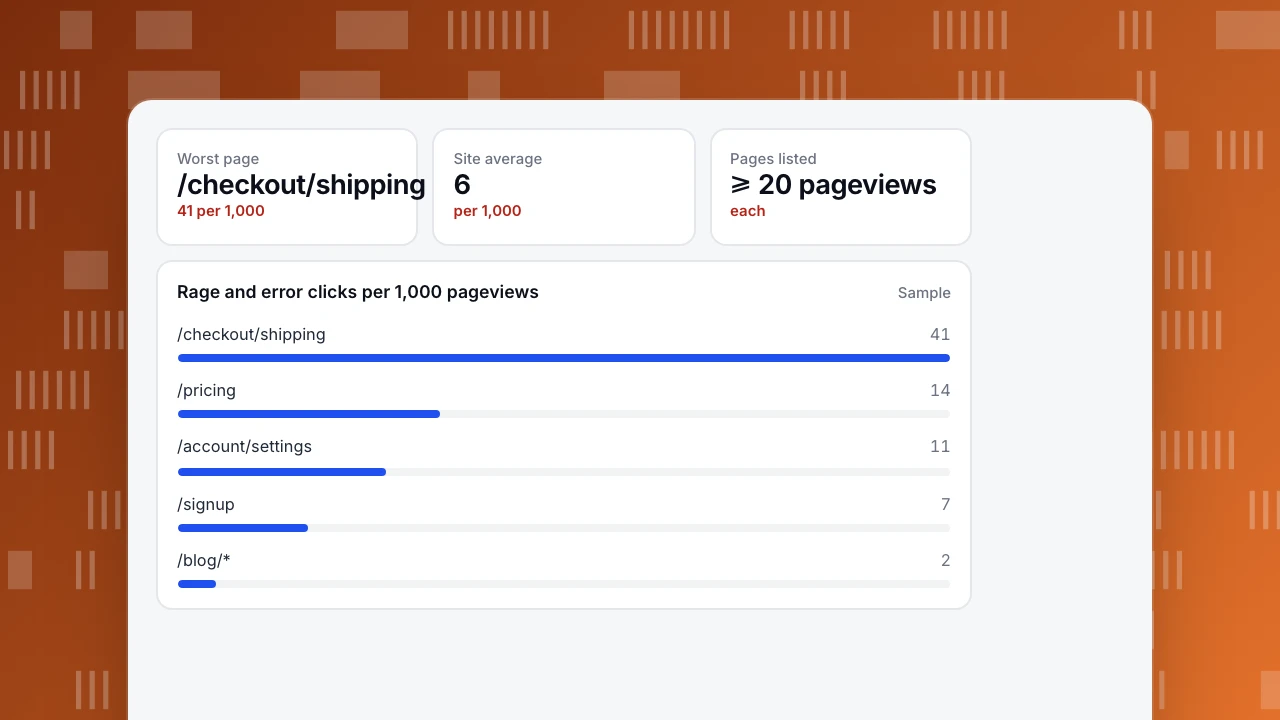
The errors report lists pages with at least 20 pageviews and ranks them by (rage + error clicks) per 1,000 pageviews.
| Signal | What it suggests | How to measure |
|---|---|---|
| Rage clicks | Something looks clickable but does not respond | Repeated fast clicks on the same spot |
| Error clicks | A click triggers a script error | Clicks followed by a JavaScript error |
| Form drop-off | A field is confusing or rejects input | Starts vs submits, by last field touched |
| Loops | People go back and forth between pages | Paths with repeated A → B → A |
| Slow steps | Waiting causes people to give up | P75 load or response time on the step |
| Dead ends | People leave from a page meant to move them on | High exit rate on a mid-journey page |
One signal is a lead; two together are strong evidence.
A worked example
A shop ranks pages by rage and error clicks per 1,000 pageviews. The shipping step of checkout scores 41, against a site average of 6. The click heatmap shows most rage clicks on the "Continue" button.
Watching a handful of session replays filtered to that page with rage clicks makes it clear: the button stays grey until a postcode is entered, but nothing says so. People click it again and again, then leave. The team adds a message next to the button and validates the postcode as people type. Rage clicks on the step fall to 5 per 1,000, and checkout completion improves.
Worst page
/checkout/shipping
41 per 1,000
Site average
6
per 1,000
Pages listed
≥ 20 pageviews
each
Rage and error clicks per 1,000 pageviews
SampleHow to rank friction points
- Reach: how many people hit it per week.
- Position: how close it is to a conversion. Friction in checkout costs more than friction on a blog.
- Severity: does it slow people or stop them?
- Effort: how hard is the fix?
Start with high reach, close to conversion, and cheap to fix.
A short routine
- Weekly: check the pages with the most rage and error clicks.
- For each new problem page, watch five replays before deciding what is wrong.
- After a fix, compare the same signal for two weeks before and after.
- For forms, look at which field people last touched before leaving. See form analytics.
FAQ
What is an example of user friction?
A sign-up form that rejects a password without saying which rule it broke, so people try several times and give up.
Is all friction bad?
No. Deliberate friction, like confirming a payment or a deletion, prevents costly mistakes. The goal is to remove friction that serves no purpose.
How do I measure friction without session replay?
Use rage clicks, error clicks, form drop-off by field and paths that loop. Replay helps confirm the cause but is not needed to find where friction is.
See also: Dead clicks, UX metrics.
See also: UX audit.
Was this article helpful?
We use your answers to fix and expand this page.
Couldn’t send. Please try again in a minute.
Thanks for the feedback. We’ll use it to improve this page.You’ve already sent feedback on this page. Thanks.

Product Adoption Consultant
Explores customer onboarding, live conversations, and self-service, turning common usage questions into practical guidance and improvements.