Try it on your own data
Every report in this article is in the free plan. One snippet for web and apps, up to 10 sites.
Start freeForm analytics shows how many people see a form, start it, submit it and get through. This guide defines the metrics for each step, shows how to track starts and validation errors without capturing field values, and lists what to fix first.
What you will learn
- Measure forms as a funnel: viewed, started, submitted, accepted
- Track field names and errors, never field values
- Report the server-accepted count as the conversion
A form is a four-step funnel
Counting submissions tells you how many forms arrived, not how many were lost. Form analytics treats each form as a small funnel:
- Viewed: the page with the form was seen.
- Started: the visitor focused a field.
- Submitted: the visitor pressed submit.
- Accepted: your server accepted it (valid, not spam, not a duplicate).
Each gap has a different cause. A low start rate is about the offer or the page; a low completion rate is about the form itself; a gap between submitted and accepted is about validation, errors or spam.
Metrics
The table defines the metrics for each step. The two that matter most are start rate (starts ÷ views) and completion rate (submits ÷ starts). Field-level drop-off (which field people leave on) needs per-field events and is worth it only for long or high-value forms.
| Metric | Formula | Points at |
|---|---|---|
| Form views | Visitors who saw the form page | Traffic and placement |
| Start rate | Starts ÷ views | Offer, copy, position |
| Completion rate | Submits ÷ starts | Form length and clarity |
| Abandonment rate | 1 − submits ÷ starts | Same, from the other side |
| Error rate | Submits blocked by validation ÷ submit attempts | Field formats, messages |
| Acceptance rate | Accepted ÷ submits | Server errors, spam, duplicates |
| Time to complete | Start to submit (median) | Effort required |
Field-level drop-off needs per-field events.
A sample funnel
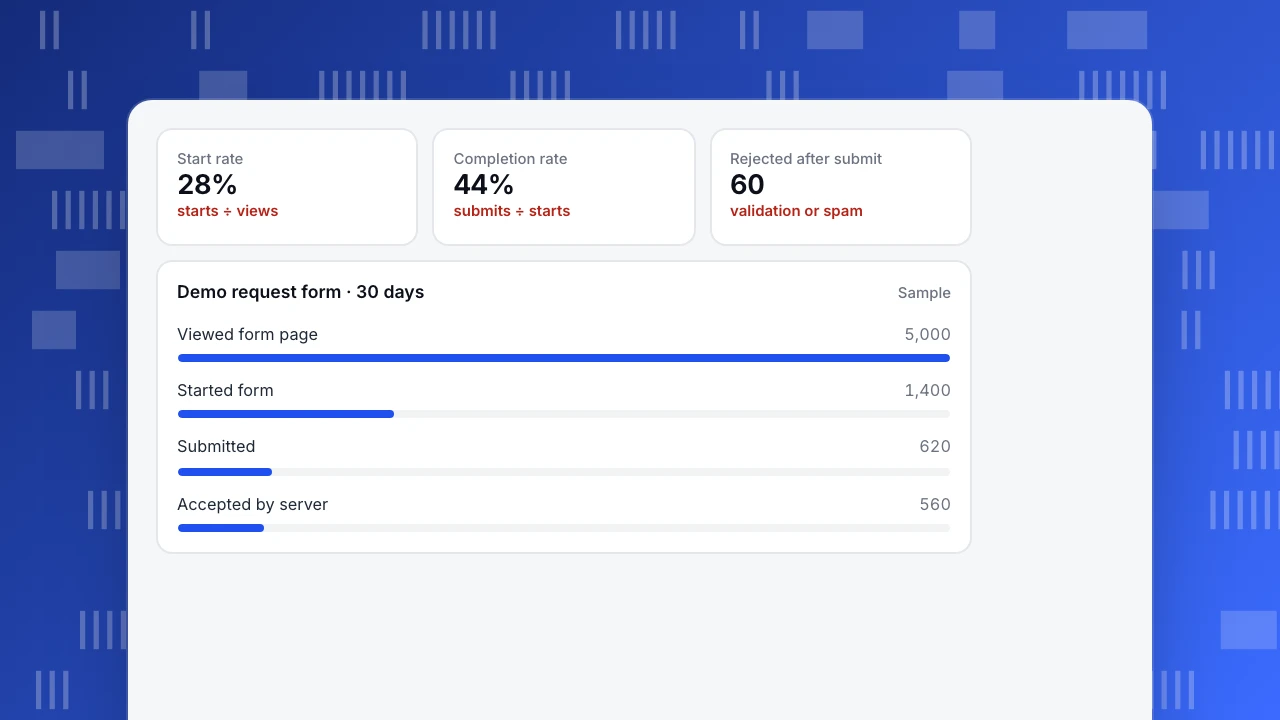
In the example, 5,000 visitors saw a demo request form and 1,400 started it, a 28% start rate. Of those, 620 submitted, a completion rate of 44%, and the server accepted 560: 60 submissions failed validation or were spam. The largest absolute loss is between starting and submitting: 780 people began and gave up. That points at the form: too many fields, a confusing field, or an error that was hard to see.
Start rate
28%
starts ÷ views
Completion rate
44%
submits ÷ starts
Rejected after submit
60
validation or spam
Demo request form · 30 days
SampleTrack starts and errors
Automatic form tracking usually records only that a form was submitted. Starts and validation errors take a few lines of code. The example below sends one event when a visitor first focuses a field, and one event listing the names of invalid fields when the browser blocks a submit. It sends field names only, never what the visitor typed: values in analytics are a privacy risk and rarely needed.
Send the accepted step from your server when the form is stored, with the same form ID. That is also where spam and duplicates are filtered, so it is the number to report as conversions (see lead tracking).
const form = document.querySelector('#demo-form');

// Send one event when the visitor first focuses a field
form.addEventListener('focusin', () => {
  if (form.dataset.started) return;
  form.dataset.started = '1';
  tapcub.track('form_start', { form_id: 'demo' });
});

// When the browser blocks a submit, send the invalid field names (never values)
let bad = [];
form.addEventListener('invalid', (e) => {
  bad.push(e.target.name);
  if (bad.length > 1) return;
  setTimeout(() => {
    tapcub.track('form_error', { form_id: 'demo', fields: bad.join(',') });
    bad = [];
  }, 0);
}, true);
What to fix first
- Low start rate: the offer, the copy around the form, or the form is below the fold.
- Low completion rate: remove optional fields, merge name fields, drop fields you can ask later.
- Many validation errors on one field: make the format clear or accept more formats (phone numbers, dates).
- Rage clicks on submit: the button looks clickable while disabled, or errors are not shown. See how to read a heatmap.
- Submitted but not accepted: check server errors and spam filtering before blaming visitors.
Treat form starts and completions as micro conversions and test changes by comparing periods.
Form analytics in TapCub
Form submit tracking is off by default. Add data-forms="true" to the script and each submit is recorded with the form's id, name and action, but not field values. Starts and errors are custom events: tapcub.track(name, props) keeps up to 20 properties, and an identical event from the same visitor on the same path within one second is dropped, so a single event per error burst is the right pattern (custom events). A funnel of form view, form_start, submit and the server's accepted event shows each step's rate and time to complete (funnels). Heatmaps (Pro plan and above, with autocapture) show clicks and rage clicks on the form, where a rage click is a third click within 300 ms and 50 px. More in conversion rate and tracking plan.
FAQ
What is form analytics?
Measuring how visitors interact with a form: how many see it, start it, submit it and get through, and where they give up.
How do I track form submissions?
Use your analytics tool's form tracking or send an event on submit, and confirm accepted submissions from the server.
How do I measure form abandonment?
Track form starts as well as submits. Abandonment rate = 1 − submits ÷ starts.
Is it safe to record what people type into forms?
It is rarely needed and creates privacy risk. Record field names and errors, not values.
What is a good form completion rate?
It depends on length and purpose. Compare your own forms over time and test removing fields.
Was this article helpful?
We use your answers to fix and expand this page.
Couldn’t send. Please try again in a minute.
Thanks for the feedback. We’ll use it to improve this page.You’ve already sent feedback on this page. Thanks.

Product Experience Specialist
Writes about product experience, practical workflows, and growth, turning complex processes into clear steps for everyday decisions.