Try it on your own data
Every report in this article is in the free plan. One snippet for web and apps, up to 10 sites.
Start freeLanding page analytics should show where on the page visitors are lost, not only how many converted. This guide sets out six metrics in page order, reads a sample scorecard of four landing pages, and gives the three patterns that point at the fix.
What you will learn
- Measure the page in the order visitors experience it: arrival to goal
- Read metrics across a row to tell a first-screen problem from a form problem
- Filter goals by entry page and source; turn on scroll depth for long pages
What landing page analytics should answer
A landing page has one job: turn a visitor who just arrived into someone who takes the next step. Conversion rate tells you how often that happens. Landing page analytics should also tell you where on the page the rest were lost, because the fix for "people leave before scrolling" is completely different from the fix for "people click the button and abandon the form".
The way to get there is to measure the page in the order a visitor experiences it.
Six metrics, in page order
The table lists the six, what each one measures and what a weak value points at. All are measured for visitors whose session started on the page, split by source and device.
You do not need all six on every page. A one-screen page with a single button needs arrival, engagement, button clicks and the goal. A long sales page needs scroll depth too.
| Metric | What it measures | A weak value points at |
|---|---|---|
| Entrances | Sessions that started on the page, by source | Wrong traffic or a broken campaign link |
| Engaged sessions | Share that stayed 10 s+, viewed 2+ pages or hit a key event | First screen, speed, ad mismatch |
| Scroll reach | Share reaching 25 / 50 / 75% of the page | Content above the fold not pulling people down |
| CTA clicks | Share who clicked the main call to action | Weak offer or a button that is hard to see |
| Form starts and completions | Started ÷ clicked, completed ÷ started | Form length, errors, mobile usability |
| Goal conversion rate | Converted ÷ entrances | Everything above; compare by source |
Measure for sessions that started on the page, split by source and device.
Reading a scorecard
Put the six metrics for every active landing page in one table and read across each row. In the sample of four pages:
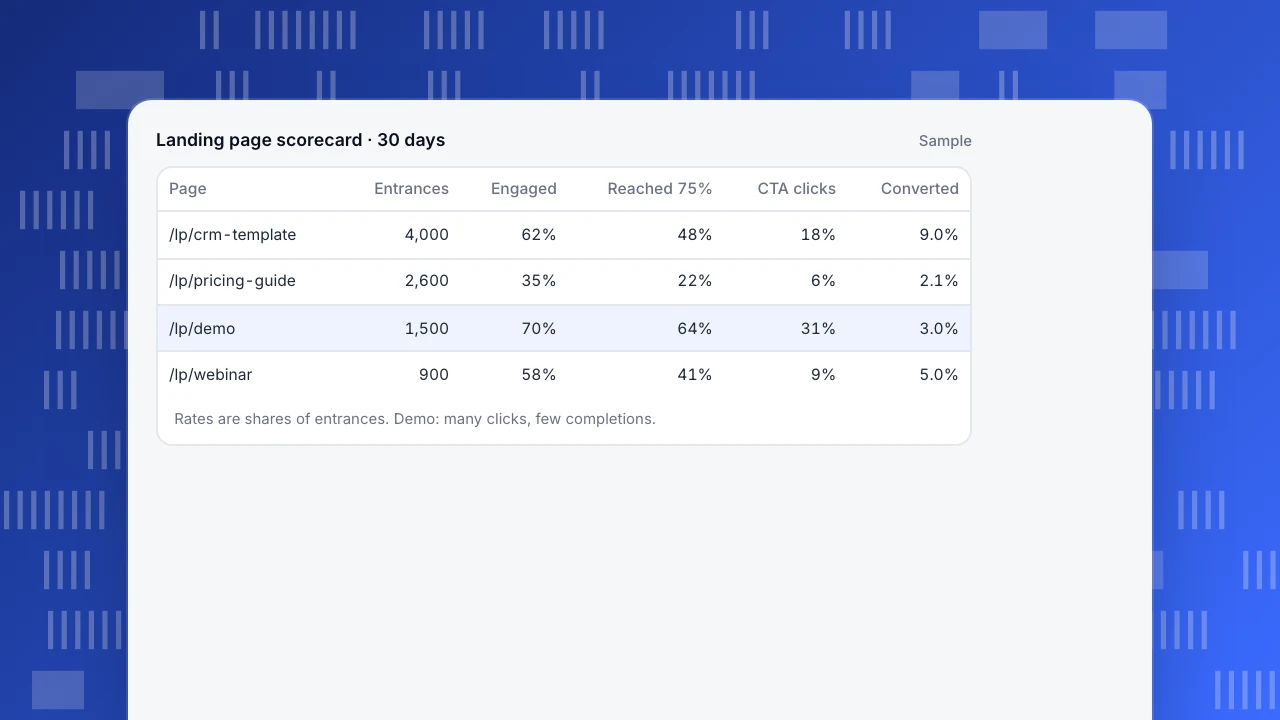
- CRM template page is healthy: most visitors engage, half reach the lower sections, 18% click and 9% convert.
- Pricing guide loses people at the top: only 35% engage and 22% scroll to the main content. The first screen is not convincing visitors that the page is for them. Look at the headline, the hero image and the match with the ad.
- Demo request has the opposite problem: 31% click the call to action, but only 3% finish. The page works; the form does not. Count the fields, look for errors on submit, and check it on mobile.
- Webinar page converts 5%, but visitors who scroll convert far better than those who do not. The registration button sits below a long agenda; a second button near the top is the obvious test.
Three patterns cover most pages: low engagement and low scroll point at the first screen; high clicks and low conversions point at the form or next step; high scroll and low clicks point at a weak or hidden call to action.
Landing page scorecard · 30 days
Sample| Page | Entrances | Engaged | Reached 75% | CTA clicks | Converted |
|---|---|---|---|---|---|
| /lp/crm-template | 4,000 | 62% | 48% | 18% | 9.0% |
| /lp/pricing-guide | 2,600 | 35% | 22% | 6% | 2.1% |
| /lp/demo | 1,500 | 70% | 64% | 31% | 3.0% |
| /lp/webinar | 900 | 58% | 41% | 9% | 5.0% |
Rates are shares of entrances. Demo: many clicks, few completions.
How to set it up
- One goal per page, as a page goal (the thank-you URL) or an event goal (the submit event). See how to track form submissions.
- Filter by entry page. In TapCub, the goals report breaks conversions down by entry page and by source, so each landing page's rate is one filter away.
- Turn on scroll depth if you want scroll reach. It is part of autocapture (Pro plan and above), and the heatmap's Scroll reach tab stays empty until Scroll depth is switched on.
- Track the call to action. Accept the button's click from the event inbox, or send a custom event, so CTA clicks sit next to conversions.
- Check speed. The performance report shows Web Vitals per page; check mobile first.
- Review weekly, and annotate every change you make to a page.
FAQ
What metrics should I track for a landing page?
Entrances, engagement (or bounce), scroll depth, call-to-action clicks, form starts and completions, and the goal conversion rate, each split by source and device.
What is the difference between a landing page and an entry page?
A landing page is a page built for a campaign. An entry page is whichever page a session started on, built for it or not. Landing page analytics uses entry-page data filtered to the pages you built.
How long should I wait before judging a landing page?
Long enough for a few hundred visitors from the main source and at least one full week, so weekday and weekend traffic are both included.
Do I need heatmaps for landing page analytics?
They help explain the scorecard: where people click, what they miss and how far they scroll. Start with the numbers, then open the heatmap on the page with the worst pattern. See how to read a heatmap.
Was this article helpful?
We use your answers to fix and expand this page.
Couldn’t send. Please try again in a minute.
Thanks for the feedback. We’ll use it to improve this page.You’ve already sent feedback on this page. Thanks.

Product Experience Specialist
Explores usability, user journeys, and feature adoption through practical examples of onboarding and everyday product use.