Try it on your own data
Every report in this article is in the free plan. One snippet for web and apps, up to 10 sites.
Start freeQuantitative data counts and measures; qualitative data explains why. This guide compares the two, lists examples of each in product and website work, and walks through an onboarding problem where the numbers find the drop and interviews and replays explain it.
What you will learn
- Quantitative finds where to look and measures the result; qualitative explains why
- Go qualitative on the one step or page where the numbers show the biggest gap
- Code qualitative notes into reasons and count them to prioritise fixes
The difference
Quantitative data is anything you can count or measure: 1,200 sign-ups, a 55% completion rate, 38 seconds on page, a satisfaction score of 7.2. It answers how many, how often and how much, and it can be added up, averaged and compared.
Qualitative data is descriptive: an interview transcript, a support conversation, an answer to "what almost stopped you from signing up?", a recording of someone hunting for a button. It answers why, how and what did they expect, and it is read and interpreted rather than added up.
In product and website work you almost always need both. Analytics tells you that 45% of new accounts never connect a data source. It cannot tell you that most of them do not have permission to create an API key.
Side by side
The table compares the two on the points that decide which to use. A useful rule: use quantitative data to find where to look and to measure whether a change worked; use qualitative data to understand what is going on and to come up with the change.
| Quantitative data | Qualitative data | |
|---|---|---|
| Answers | How many, how often, how much | Why, how, what they expected |
| Form | Numbers, counts, rates | Words, recordings, observations |
| Typical sources | Analytics events, funnels, surveys with ratings | Interviews, replays, chats, open survey answers |
| Sample size | Large: hundreds to millions | Small: 5–40 is often enough |
| Analysis | Sum, average, compare, test | Read, code into themes, quote |
| Strength | Shows size and trend; measures change | Explains cause; suggests the fix |
| Risk | Shows what, not why; easy to over-read | Small samples; loud voices over-represented |
Use quantitative to choose where to look, qualitative to understand it.
Examples of each in product and website work
Quantitative: pageviews, unique visitors, conversion and bounce rates, funnel step completion, retention by cohort, event counts, revenue per user, survey ratings (a 1–10 score is a number), load times, rage-click counts.
Qualitative: user interviews, usability test notes, open-ended survey answers, support tickets and chat conversations, sales call notes, app store reviews, session replays, the comments field on a cancellation form.
Some sources are both. A heatmap is a count of clicks, but you read it like a picture. A cancellation survey has a multiple-choice reason (quantitative) and a free-text box (qualitative).
A worked example: why new accounts stall
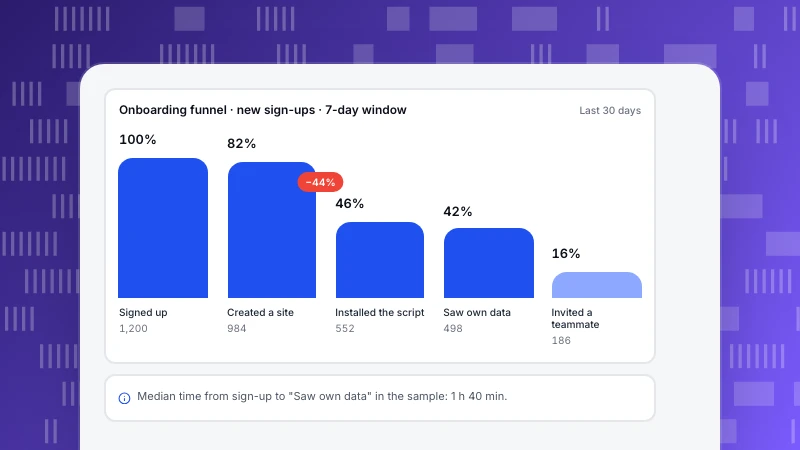
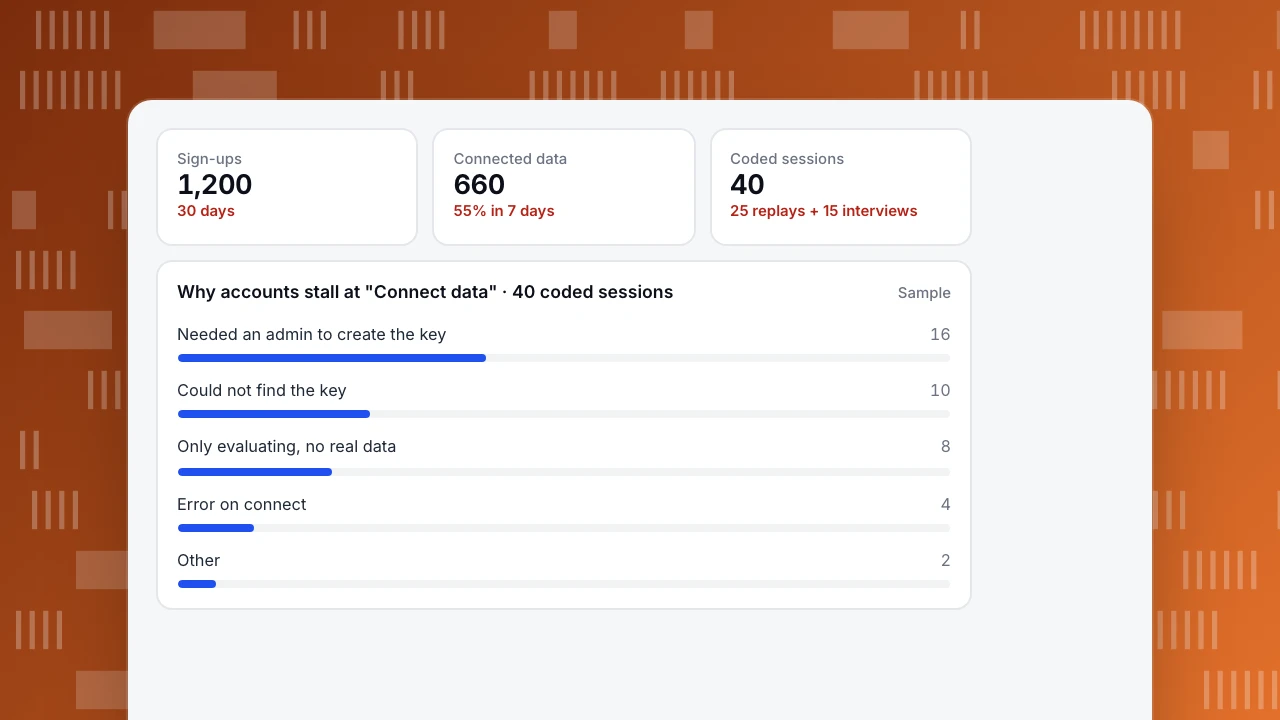
A B2B tool sees 1,200 sign-ups in a month. The funnel shows 660 of them connect a data source within seven days, a 55% completion rate. That is the quantitative finding: the step loses 540 accounts, and it is the largest drop in onboarding.
The team then watches 25 session replays of accounts that reached the step and left, and runs 15 short interviews. The notes are coded: each session or interview gets one main reason. The chart shows the result. Sixteen of the 40 (40%) needed someone else, usually an admin, to create the key; ten could not find where the key was; eight were evaluating and had no real data to connect yet.
Coding turned qualitative notes into counts the team could prioritise. The fix for the top reason was an "invite a teammate to finish setup" link on the step, which a numbers-only view would never have suggested. The quantitative metric (step completion) then measures whether it worked.
Sign-ups
1,200
30 days
Connected data
660
55% in 7 days
Coded sessions
40
25 replays + 15 interviews
Why accounts stall at "Connect data" · 40 coded sessions
SampleHow to combine them
- Start with numbers to pick the question. Find the step, page or segment where the gap is largest.
- Go qualitative on that spot only. Watch replays, read conversations and interview people from that step. Five to ten interviews often show the main reasons.
- Code the answers. Give each note one main reason, count them, and check whether the top reasons cover most cases.
- Change one thing and measure it with numbers. Compare the step completion rate before and after, ideally with a test.
FAQ
Is survey data qualitative or quantitative?
Both. Ratings and multiple-choice answers are quantitative; free-text answers are qualitative. Ask one rating and one open question, and code the open answers.
How much qualitative data is enough?
For finding the main reasons behind one problem, 5–15 interviews or 20–40 replays are usually enough to see the same reasons repeat. For measuring how common each reason is across all users, follow up with a survey.
Can qualitative data be analysed with numbers?
Yes, by coding: tag each item with a category, then count categories. Keep the original quotes next to the counts; they explain the reason better than the label.
Is session replay qualitative data?
A replay of one session is qualitative: you watch and interpret it. Counts across replays, such as how many had rage clicks or errors, are quantitative.
Related: UX analytics and session replay.
See also: What is qualitative data? Types, examples and how to analyze it.
Was this article helpful?
We use your answers to fix and expand this page.
Couldn’t send. Please try again in a minute.
Thanks for the feedback. We’ll use it to improve this page.You’ve already sent feedback on this page. Thanks.

Product Adoption Consultant
Explores customer onboarding, live conversations, and self-service, turning common usage questions into practical guidance and improvements.