Try it on your own data
Every report in this article is in the free plan. One snippet for web and apps, up to 10 sites.
Start freeUse a transparent evidence matrix before changing a roadmap. Compare three features without treating popularity as value or correlation as proof.
What you will learn
- Map user tasks to completed outcomes before querying
- Compare eligible populations rather than raw totals
- Keep retention association separate from causal impact
- Check rare but essential workflows before retirement
Product feature analysis evaluates a capability’s reach, successful use, repeat use, user value and operating cost to decide what to improve, preserve or retire. Start with eligible users and a completed outcome, then combine behavioral data with research. A popularity ranking alone cannot tell you whether a feature is essential, hard to discover or expensive to maintain.
Make one decision explicit
“Which features are used most?” is a useful inventory question. “Should we simplify bulk export, invest in scheduling or retire an old report builder?” is a product decision. The latter needs more than event totals: eligibility, workflow dependencies, quality, maintenance and the people affected by a change.
This guide analyzes features that already exist. It is not a competitive checklist, a machine-learning feature-importance technique or a survey-based preference model. Those methods answer different questions. The feature adoption guide explains the adoption funnel in detail; the decision matrix here adds the evidence needed before allocating or withdrawing investment.
Amplitude’s feature-analysis article discusses feature catalogs, available audiences and usage measures. Our additional contribution is a reproducible sample matrix and a decision record that keeps behavioral evidence separate from assumptions about value.
Build a feature catalog before querying events
Define the capability in terms a user recognizes. “Export a completed report” is clearer than a frontend component name. A single feature may have several events, and one navigation event may lead into several features. Without a catalog, teams can count the same action twice or compare unlike activities.
| Catalog field | What to record |
|---|---|
| User task | The outcome the capability makes possible |
| Eligible population | Plans, permissions, platforms and release availability |
| Successful-use event | A completed business outcome, not merely an attempted click |
| Event exclusions | Retries, test traffic and known automated activity |
| Expected cadence | Per session, weekly, monthly or when a specific need arises |
| Dependencies | Other workflows, integrations or contractual expectations |
| Cost owner | Team responsible for support, reliability and maintenance |
Check instrumentation with someone who owns the workflow. A download-start event may fire before a file exists. A scheduling click may be a failed permission check. If completion is unobservable, list that limitation instead of presenting attempted use as delivered value.
Version the catalog when behavior changes. Keep the release date and event definition so a spike caused by a tracking change does not become a false success story. Avoid collecting report contents or free-form text just to count that an export happened.
Measure reach, depth and return separately
Use a common unit within each calculation. For a personal task, count distinct people. For shared organizational work, use accounts or workspaces where your identity data supports that view. Publish both only when each has its own definition.
Reach is distinct successful users divided by the eligible population in the stated window. It answers how broadly the capability is used among those who can use it. It does not measure satisfaction.
Frequency describes successful uses per user or active days among successful users. Report a distribution or median where concentration matters. An average can hide a few automated accounts generating most of the activity.
Repeat use asks whether first users return for another successful outcome within a window aligned with the task. A monthly export feature should not be judged on next-day return simply because that is an easy chart to create.
Quality and effort add failure attempts, completion obstacles and support burden. Keep attempt-based error rates separate from user-based adoption. Pair the numbers with task observations or interviews, especially when a feature appears unused but is needed for rare, important work.
For a recurring overview, use the guide to measuring product adoption. This article is the decision review, not a requirement to add every measure to a permanent dashboard.
Recalculate the sample feature matrix
The following is sample data, invented for a collaboration product. All repeat-use cohorts have completed the same fourteen-day follow-up. The feature-specific populations differ because access and relevance differ.
| Feature | Eligible users | Successful users | Reach | Repeated users | Repeat among successful users |
|---|---|---|---|---|---|
| Comments | 1,000 | 500 | 50% | 350 | 70% |
| Bulk export | 200 | 120 | 60% | 90 | 75% |
| Scheduled reports | 1,000 | 100 | 10% | 20 | 20% |
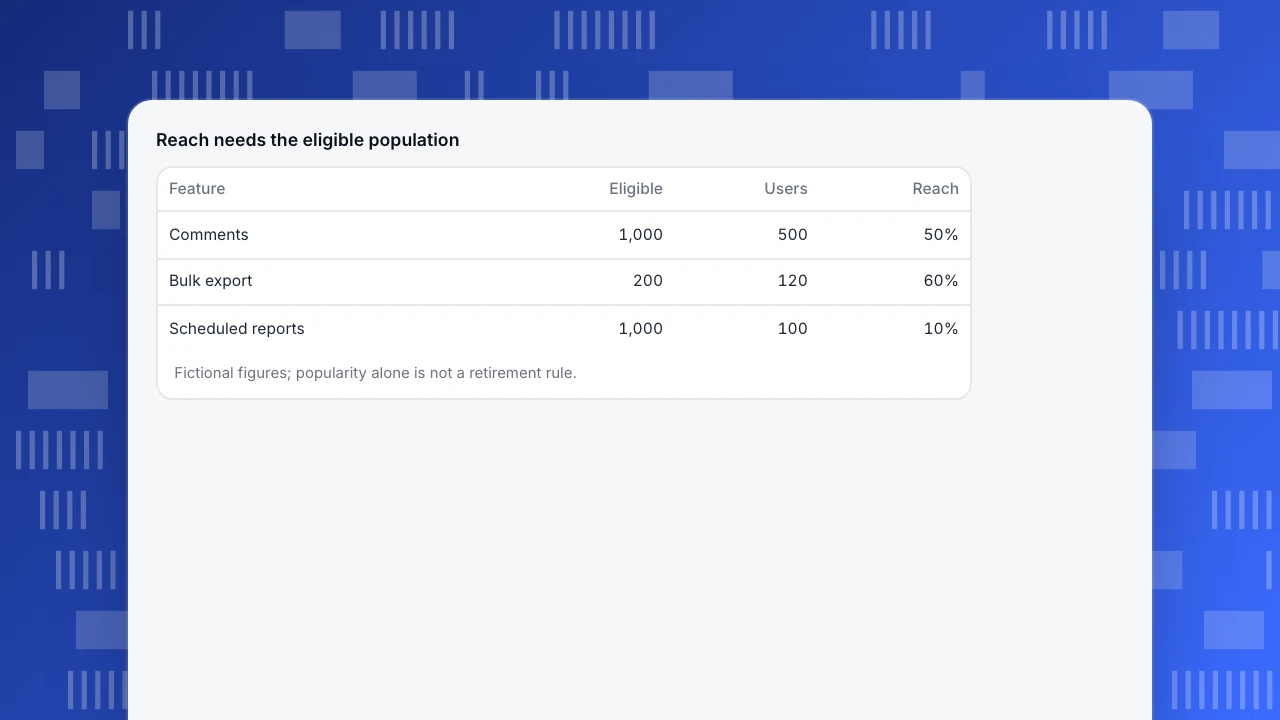
Comments reach is 500 / 1,000 = 50%. Bulk export reach is 120 / 200 = 60%. Scheduled reports reach is 100 / 1,000 = 10%. The repeat rates are 350 / 500 = 70%, 90 / 120 = 75% and 20 / 100 = 20% respectively.
A raw-user ranking puts bulk export below comments: 120 versus 500. Within its eligible population, however, export has greater reach. That does not prove export deserves more investment. It establishes that the “small audience means unused” argument is incomplete.
Add evidence before choosing an action:
| Feature | Additional evidence to request | Provisional decision |
|---|---|---|
| Comments | Failure trend, task observations and the needs of non-users | Maintain reliability; investigate specific friction |
| Bulk export | Which workflows depend on it and which accounts would be blocked | Preserve while checking unmet export needs |
| Scheduled reports | Whether users know it exists, can configure it and need a fortnightly return | Research the journey before promoting or retiring it |
The final column is conditional. Without the additional evidence, it is a research agenda rather than a recommendation to spend or remove functionality. Do not turn these sample rates into “good” industry thresholds.
Reach needs the eligible population
| Feature | Eligible | Users | Reach |
|---|---|---|---|
| Comments | 1,000 | 500 | 50% |
| Bulk export | 200 | 120 | 60% |
| Scheduled reports | 1,000 | 100 | 10% |
Fictional figures; popularity alone is not a retirement rule.
Do not confuse retention association with impact
Suppose 80 of 100 feature users return next month, compared with 200 of 400 non-users. The observed return rates are 80% and 50%, a 30 percentage-point difference. That is an association, not proof that the feature created a thirty-point improvement.
Feature users may have older accounts, different plans or a stronger underlying need. They also had to stay long enough to become feature users. Defining “used at any time this month” and comparing retention during that same month can build survival and timing differences into the groups.
Define exposure before the outcome window. Compare cohorts with similar tenure and eligibility, and explain remaining differences. If a causal decision matters, use a suitable experiment or another justified causal design. TapCub provides behavioral analysis; this guide does not claim it runs feature-flag experiments or preference surveys. See correlation versus causation.
Treat low-frequency essentials differently
Password recovery, accessibility controls and billing exports may be infrequent but critical when needed. A popularity cutoff would misclassify them. Ask whether the task is required for access, recovery, compliance obligations or a customer’s workflow before using low reach as an argument for removal.
Investigate hidden dependence. A small number of administrators may generate exports that many colleagues rely on. The event stream can show the administrator’s action while missing downstream use. Talk to the relevant account owner and document the workflow before drawing conclusions.
Likewise, high frequency can mean friction. Repeatedly reopening a settings screen might reflect confusion, not enthusiasm. Combine completion, quality and observation so the decision is based on successful outcomes rather than activity volume alone.
Write a decision record, not an opaque score
An additive feature score can conceal judgments. Instead, use a compact record with evidence and uncertainty visible:
| Record field | Example entry |
|---|---|
| Decision | Investigate scheduled-report setup before expanding promotion |
| Evidence | Low first use and low fourteen-day repeat in a mature cohort |
| Alternative explanation | The expected reporting cadence might be monthly |
| Missing evidence | Task observations and customer reporting frequency |
| Owner and next action | Product researcher to pilot a setup task study |
| Review trigger | After the research and a full relevant return window |
| Guardrail | Do not remove existing schedules during investigation |
For retirement, add dependency owners, affected accounts, migration options and communication responsibilities. A matrix can identify a candidate; it cannot authorize deleting a capability or ignoring an existing customer promise. Keep the review date meaningful by tying it to new evidence rather than repeating the same unsupported vote each week.
Collect the behavioral part in TapCub
Use All-platform analytics › Behavior › Event analysis for event counts and trends; select funnels for completion stages and retention for a defined return action. Save the analyses so the team can revisit the same definitions. The model-selection guide documents which questions each model answers.
Plan eligibility and account identifiers before expecting account-level results. Maintenance cost, contract dependencies and interview findings usually come from other systems; keep them in the decision record with provenance. Do not present a combined value score as an automatic output of event analysis.
For recurring adoption reporting, use a narrowly defined dashboard. For qualitative obstacles, run a task study alongside the behavioral review. Each evidence source should answer a named uncertainty instead of being added merely to make the document look complete.
FAQ
What is the difference between feature analysis and feature adoption?
Adoption examines discovery, first use and repeated use. Feature analysis uses that evidence alongside value, quality, cost and dependencies to support investment or retirement decisions. Adoption is one input rather than the entire decision.
Should I remove a feature with low usage?
Not from usage alone. Check eligibility, observability, expected frequency and workflow dependence. A recovery or export feature can be valuable despite a small audience. Document the evidence and a safe alternative before considering retirement.
Does higher retention among feature users prove success?
It shows association. Cohort age, plan, intent and exposure timing can explain the difference. Keep the observation useful while stating that it does not establish causal impact.
Is a single weighted score necessary?
No. A transparent matrix plus a decision record can be easier to review. If a team uses weights, publish their rationale, sensitivity and missing-data rules rather than treating the final score as objective truth.
Sources and next step
Sources checked on November 7, 2026: Amplitude: feature analysis, Hex: conducting feature analysis and TapCub: analysis models. All sample figures, calculations and decision records were created for this article. Begin with three features and one decision, then fill the missing evidence before ranking investment.
Was this article helpful?
We use your answers to fix and expand this page.
Couldn’t send. Please try again in a minute.
Thanks for the feedback. We’ll use it to improve this page.You’ve already sent feedback on this page. Thanks.

Product Analyst
Focuses on event analysis, conversion funnels, and retention, using clear metric definitions and structured analysis to explain product performance.