Try it on your own data
Every report in this article is in the free plan. One snippet for web and apps, up to 10 sites.
Start freeA customer sees a social ad, later searches your brand, opens an email and finally comes back directly to buy. Which channel gets the credit? Single-touch models give all of it to the first or last visit. Multi-touch attribution shares it across the touchpoints, using rules or data. Below, every common model is applied to that same journey so you can see exactly how credit moves, followed by what the models cannot tell you and how to set attribution up so the numbers are worth using.
What you will learn
- Different models answer different questions; compare two or three rather than trusting one
- Channels that open journeys look weak under last touch and strong under first touch
- Attribution shows contribution along observed paths, not incrementality; test that separately
What is multi-touch attribution?
Multi-touch attribution (MTA) assigns credit for a conversion to several of the marketing touchpoints that preceded it, instead of giving all of it to one. A touchpoint is usually a visit with a known source: an ad click, an organic search, an email, a referral. The model decides how to split the credit.
The goal is a fairer picture of which channels contribute, so budget is not cut from channels that start journeys just because they rarely finish them.
Single-touch vs multi-touch
Single-touch models are simple and often misleading:
- Last touch gives everything to the final visit. It rewards brand search, direct visits and email, which tend to close journeys other channels started.
- First touch gives everything to the first visit. It rewards awareness channels and ignores what convinced people.
Multi-touch models spread credit across the journey. None is "correct"; each encodes an assumption about what matters. The table below summarises the common models.
The common models
The rule-based models are fixed formulas; data-driven models learn weights from your conversion data. Details of each are in the table; the next section applies them to a single journey so you can see what the formulas do.
| Model | How credit is split | Favours | Use it to ask |
|---|---|---|---|
| First touch | All to the first touch | Awareness channels | What starts journeys? |
| Last touch | All to the last touch | Closing channels (direct, brand search, email) | What finishes journeys? |
| Linear | Equally across all touches | Channels that appear often | Which channels show up at all? |
| Position-based (U-shaped) | 40% first, 40% last, 20% shared by the middle | Openers and closers | Who starts and who closes? |
| Time decay | More to touches closer to the conversion | Late-stage channels | What pushed people over the line? |
| Data-driven | Learned from converting vs non-converting paths | Depends on data | Which touches change the odds? |
W-shaped models add a third 'anchor' (often lead creation) to the position-based split.
One journey under five models
Sample data: one customer's path to a purchase, with the number of days before the conversion.
- Paid social ad click, 20 days before
- Organic search for the brand, 12 days before
- Email newsletter click, 3 days before
- Direct visit and purchase, day 0
| Model | Paid social | Organic search | Direct | |
|---|---|---|---|---|
| First touch | 100% | 0% | 0% | 0% |
| Last touch | 0% | 0% | 0% | 100% |
| Linear | 25% | 25% | 25% | 25% |
| Position-based (40/20/40) | 40% | 10% | 10% | 40% |
| Time decay (7-day half-life) | 6.3% | 13.9% | 34.0% | 45.8% |
How the time-decay row is computed: each touch gets a weight of 2^(−days ÷ 7): 0.138, 0.305, 0.743 and 1.000. They sum to 2.186; dividing each weight by the sum gives the shares. A touch 7 days before the conversion counts half as much as one on the day.
The same purchase gives paid social anything from 0% to 100% of the credit depending on the model. That is not a flaw to be fixed by picking the right model; it is the reason to compare several.
Channels under three models
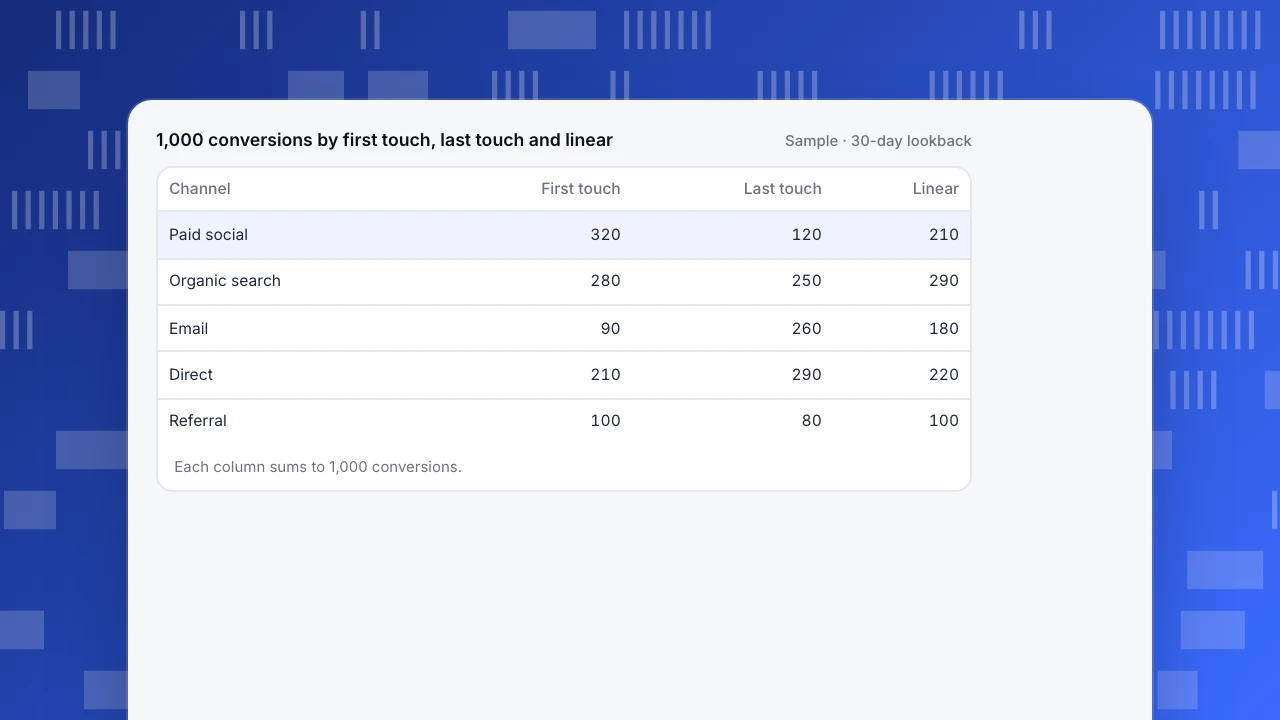
Across 1,000 sample conversions, the differences add up. Paid social opens 320 journeys (first touch) but closes only 120 (last touch); email does the reverse, 90 vs 260. Under linear credit, both land in between. A team that reports only last touch would conclude paid social is the weakest channel and cut it, then see first visits, and later conversions, fall.
A practical reading of the table: use first touch to judge which channels bring new people in, last touch to judge which channels close, and linear or position-based for overall budget conversations.
1,000 conversions by first touch, last touch and linear
Sample · 30-day lookback| Channel | First touch | Last touch | Linear |
|---|---|---|---|
| Paid social | 320 | 120 | 210 |
| Organic search | 280 | 250 | 290 |
| 90 | 260 | 180 | |
| Direct | 210 | 290 | 220 |
| Referral | 100 | 80 | 100 |
Each column sums to 1,000 conversions.
Data-driven attribution
Data-driven attribution compares the paths of people who converted with those who did not, and estimates how much each touch changes the probability of converting. Google has described the data-driven attribution in Analytics and Ads as drawing on Shapley values from cooperative game theory, which share a total among players according to their marginal contributions. Academic work such as Dalessandro and colleagues (2012) frames attribution as estimating each channel's causal effect.
It needs a lot of conversion data, it is harder to explain, and it is still built on observed paths, so it inherits the limits below.
What multi-touch attribution cannot tell you
- Incrementality. Attribution shows which channels appear on converting paths, not whether those people would have converted anyway. Brand search and retargeting look excellent on paths of people who were already going to buy. Measure lift with holdouts or experiments; see incrementality.
- Impressions. Most web-based attribution sees clicks and visits, not ads that were seen but not clicked.
- Cross-device journeys without a login appear as separate people.
- Offline touches (events, sales calls, word of mouth) are invisible unless you import them.
- Consent and privacy. Visitors who decline tracking or block scripts leave gaps in paths.
- Long cycles outside the lookback window are cut off.
For budget decisions at the channel level, many teams combine MTA with marketing mix modelling and periodic incrementality tests.
How to set up attribution you can trust
- Define one conversion per analysis: purchase, sign-up, demo request.
- Tag your links consistently. UTM parameters on every campaign link, with a naming convention; otherwise touches fall into "direct" or "referral".
- Choose a lookback window that fits your cycle: 7 days for impulse purchases, 30–90 days for B2B.
- Decide the identity: visitor, device or logged-in user. Logged-in identity joins devices.
- Compare two or three models side by side and write down which question each answers.
- Review quarterly, and validate big conclusions with an incrementality test.
The difference between attribution and the order in which people move through your site is covered in conversion paths.
Multi-touch attribution in TapCub
Attribution is a view in All-platform analytics › Behavior › Behavior analysis:
- Goal: one event or page, written like a funnel step.
- Touch: channel by default (falling back to the referrer channel), or referrer channel, UTM source, UTM campaign, referrer domain or landing page.
- Lookback window: 30 days by default, 1 to 90, including the session of the conversion itself.
- Models: first touch, last touch, linear, position (one touch gets all; two split half each; with more, first and last get 40% each and the middle share 20%) and time decay (half-life 7 days by default, 1 to 90), selected together and shown as columns.
- Optional earlier event to keep only touches after, say, a sign-up.
- Results: conversions, attributed conversions, conversions with no touch, average touches per attributed conversion, and per touch value the credit under each model, paths and touch rate.
Up to 50,000 conversions are scored per query. It uses on-site sessions; TapCub does not match ad clicks to app installs. Step-by-step setup is in compare attribution models.
FAQ
What is the difference between multi-touch and single-touch attribution?
Single-touch attribution gives all the credit for a conversion to one touchpoint, usually the first or last. Multi-touch attribution splits it across several touchpoints using a rule or a data-driven model.
Which multi-touch attribution model is best?
None in general. Position-based is a reasonable default for budget discussions; first touch answers what brings new people in; last touch answers what closes. Compare two or three and confirm major decisions with incrementality tests.
What is a U-shaped attribution model?
A position-based model that gives 40% of the credit to the first touch, 40% to the last and shares the remaining 20% among the touches in between.
Is multi-touch attribution still possible with privacy rules?
Yes, within limits. First-party analytics on your own site still sees visits and their sources; journeys across devices without a login, ad impressions and visitors who decline tracking are the main gaps.
Sources
- Google Analytics Help, Get started with attribution.
- Google Ads Help, About data-driven attribution.
- Dalessandro, B., Perlich, C., Stitelman, O. and Provost, F. (2012). Causally Motivated Attribution for Online Advertising. ADKDD '12.
- Shapley, L. S. (1953). A Value for n-Person Games. In Contributions to the Theory of Games II. Princeton University Press.
Was this article helpful?
We use your answers to fix and expand this page.
Couldn’t send. Please try again in a minute.
Thanks for the feedback. We’ll use it to improve this page.You’ve already sent feedback on this page. Thanks.

Product Analyst
Focuses on event analysis, conversion funnels, and retention, using clear metric definitions and structured analysis to explain product performance.