Try it on your own data
Every report in this article is in the free plan. One snippet for web and apps, up to 10 sites.
Start freeMost data strategies fail by starting with tools or by trying to do everything. This guide frames strategy as offense and defense, lists the seven components, and scores six real-looking use cases by value and feasibility to produce a 90-day plan with owners, deferred items and metrics that show whether the strategy is working.
What you will learn
- Start from business goals and decisions, not tools
- Balance defense (quality, privacy) with offense (growth)
- Score use cases by value × feasibility; pick three to five
- Build only the foundation those use cases need
- Measure changed decisions, not dashboards built
What is a data strategy?
A data strategy is a plan that connects what a business wants to achieve with how it will collect, manage, govern and use data to get there. It answers four questions: Which decisions and products should data improve? What data do we need? How will we make it reliable and safe? Who will use it, and with what skills and tools?
A data strategy is not a list of tools, and it is not the same as a first-party data strategy, which is one part of it focused on customer data you collect directly. Good data strategies are short, tied to business goals and reviewed every quarter.
Offense and defense
DalleMule and Davenport (Harvard Business Review, 2017) describe two sides every data strategy has to balance:
| Data defense | Data offense | |
|---|---|---|
| Goal | Minimize risk | Increase revenue, profit and customer satisfaction |
| Activities | Compliance, privacy, security, data quality, access control | Analytics, modeling, personalization, new data products |
| Typical owner | Chief data officer, legal, security | Product, marketing, sales, analytics |
| Needs | A single source of truth for core data | Flexibility to create multiple, purpose-built views |
Regulated industries lean toward defense; fast-growing startups lean toward offense. Neither can be ignored: offense on untrustworthy data produces wrong decisions faster.
| Defense | Offense | |
|---|---|---|
| Goal | Minimize risk | Grow revenue |
| Activities | Compliance, quality, security | Analytics, models, personalization |
| Needs | Single source of truth | Flexible purpose-built views |
Regulated industries lean to defense; startups lean to offense.
The seven components of a data strategy
- Business goals. Two or three company objectives the strategy serves (for example, grow net revenue retention to 110%).
- Use cases. Specific decisions or products data will improve, each with an owner and a measurable outcome.
- Data sources and gaps. What you already collect (product events, billing, CRM, support) and what is missing.
- Architecture. How data flows from sources to people: collection, pipeline, storage, tools.
- Governance. Definitions, ownership, access, privacy and quality rules. See data governance.
- People and skills. Who analyzes, who builds, how others learn to self-serve. See data democratization.
- Roadmap and metrics. What happens in the next 90 days and how you will measure whether the strategy is working.
Worked example: prioritizing data use cases
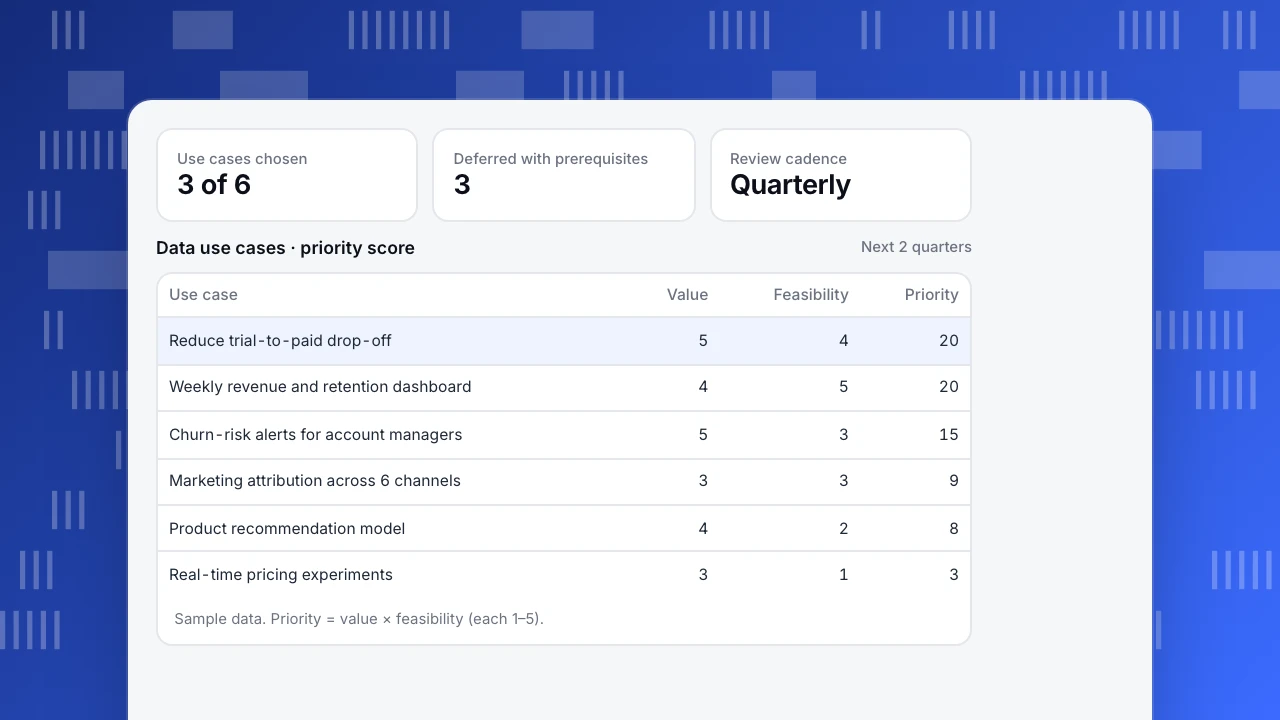
A 120-person B2B SaaS company listed six candidate use cases and scored each for business value (1–5) and feasibility with current data and skills (1–5). Priority = value × feasibility (sample data):
| Use case | Value | Feasibility | Priority |
|---|---|---|---|
| Reduce trial-to-paid drop-off | 5 | 4 | 20 |
| Weekly revenue and retention dashboard | 4 | 5 | 20 |
| Churn-risk alerts for account managers | 5 | 3 | 15 |
| Marketing attribution across 6 channels | 3 | 3 | 9 |
| Product recommendation model | 4 | 2 | 8 |
| Real-time pricing experiments | 3 | 1 | 3 |
The plan for the next 90 days:
- Trial-to-paid drop-off (20): instrument the onboarding funnel with a tracking plan, find the biggest step loss, fix it.
- Revenue and retention dashboard (20): agree definitions for MRR, churn and active accounts, build one certified dashboard.
- Churn-risk alerts (15): start with simple rules (no login in 14 days plus a support complaint) before any model.
Deferred: attribution across six channels needs cleaner UTM data first (feasibility 3); the recommendation model and real-time pricing need data and skills the company does not have yet. They stay on the roadmap with the prerequisite named.
How progress is measured: trial-to-paid conversion, share of leadership decisions that cite the certified dashboard, number of data quality incidents per month, and median time to answer a business question.
Use cases chosen
3 of 6
Deferred with prerequisites
3
Review cadence
Quarterly
Data use cases · priority score
Next 2 quarters| Use case | Value | Feasibility | Priority |
|---|---|---|---|
| Reduce trial-to-paid drop-off | 5 | 4 | 20 |
| Weekly revenue and retention dashboard | 4 | 5 | 20 |
| Churn-risk alerts for account managers | 5 | 3 | 15 |
| Marketing attribution across 6 channels | 3 | 3 | 9 |
| Product recommendation model | 4 | 2 | 8 |
| Real-time pricing experiments | 3 | 1 | 3 |
Sample data. Priority = value × feasibility (each 1–5).
How to write a data strategy in five steps
- Interview leaders about the top decisions they make and where they lack information. Write down questions, not tool requests.
- Map current data: sources, owners, quality, gaps. A one-page inventory is enough.
- Score use cases by value and feasibility, pick three to five for the next two quarters.
- Define the minimum foundation those use cases need: events to track, definitions, pipelines, access rules. Do not build for hypothetical future needs.
- Publish a one-page strategy with goals, chosen use cases, owners, a 90-day roadmap and success metrics. Review quarterly.
Common mistakes
- Starting with tools. Buying a warehouse or BI tool before agreeing on use cases.
- Collecting everything "just in case". It raises cost and privacy risk without a use.
- No owners. Every use case and every core metric needs one person accountable.
- Ignoring defense. Privacy and quality problems surface later as legal risk or lost trust in numbers.
- Measuring output, not outcomes. "We built 40 dashboards" is not success; changed decisions are.
- A 50-page document no one reads. Keep the strategy short enough to remember.
Putting it into practice with TapCub
TapCub covers the product and website side of a data strategy: a tracking plan with a data quality page, goals and custom metrics for shared definitions, funnels for use cases like trial conversion, and privacy controls (cookieless counting, collection tiers, IP truncation) for the defensive side. When your warehouse is the central store, export raw data and join it with billing and CRM.
See also: Data maturity model.
Sources
- DalleMule, L. and Davenport, T. H. (2017). What's your data strategy? Harvard Business Review, May–June 2017.
- Marr, B. (2021). Data Strategy, 2nd ed. Kogan Page.
- DAMA International (2017). DAMA-DMBOK, 2nd ed. Technics Publications.
Was this article helpful?
We use your answers to fix and expand this page.
Couldn’t send. Please try again in a minute.
Thanks for the feedback. We’ll use it to improve this page.You’ve already sent feedback on this page. Thanks.

Product Experience Specialist
Writes about product experience, practical workflows, and growth, turning complex processes into clear steps for everyday decisions.