Try it on your own data
Every report in this article is in the free plan. One snippet for web and apps, up to 10 sites.
Start freeLTV:CAC is the quickest test of whether growth is paying for itself, and the easiest number to flatter. This guide calculates it the conservative way (gross margin, full CAC), then splits a blended 2.6 by channel to reveal paid search at 1.25 with a 25-month payback, and covers benchmarks, mistakes and how to improve each side.
What you will learn
- LTV : CAC = margin-based LTV ÷ fully loaded CAC
- Around 3 is the common SaaS target; pair it with payback
- Blended ratios can hide a channel that loses money
- Revenue-based LTV and media-only CAC inflate the ratio
- A rising ratio can also mean you cut growth spending
What is the LTV to CAC ratio?
The LTV to CAC ratio compares how much gross profit a customer brings over their lifetime (customer lifetime value, LTV) with how much it cost to acquire them (customer acquisition cost, CAC). It answers a basic question for any subscription or repeat-purchase business: does each new customer earn back what we spent to win them, with room to spare?
LTV : CAC = LTV ÷ CAC
A ratio of 3 means each customer is expected to return three dollars of gross profit for every dollar of sales and marketing spent acquiring them.
How to calculate LTV and CAC
LTV (simple subscription formula):
LTV = (ARPA × gross margin %) ÷ monthly churn rate
- ARPA: average revenue per account per month.
- Gross margin: revenue minus cost of serving the customer (hosting, support, payment fees). Use margin, not revenue, or the ratio will flatter you.
- Churn rate: share of customers lost per month. 1 ÷ churn is the expected lifetime in months.
CAC:
CAC = total sales and marketing cost in a period ÷ new customers acquired in that period
Include salaries, tools, agencies and ad spend, not only media cost. CAC computed from ad spend alone is "paid CAC" and is useful per channel, but it is not the full CAC.
Worked example: blended and by channel
A B2B SaaS company, one quarter (sample data):
- ARPA $120 a month, gross margin 80%: $96 of gross profit per customer per month.
- Monthly customer churn 2.5%: expected lifetime 40 months.
- LTV = 96 ÷ 0.025 = $3,840.
- Sales and marketing cost $180,000; 120 new customers. CAC = $1,500.
- LTV : CAC = 3,840 ÷ 1,500 = 2.56.
- CAC payback = CAC ÷ monthly gross profit = 1,500 ÷ 96 = 15.6 months.
A blended 2.6 looks acceptable. Split by acquisition channel, the picture changes:
| Channel | New customers | Cost | CAC | Monthly churn | LTV | LTV : CAC | Payback |
|---|---|---|---|---|---|---|---|
| Paid search | 50 | $120,000 | $2,400 | 3.2% | $3,000 | 1.25 | 25 months |
| Organic and content | 45 | $31,500 | $700 | 2.0% | $4,800 | 6.9 | 7 months |
| Partners | 25 | $28,500 | $1,140 | 2.4% | $4,000 | 3.5 | 12 months |
| Blended | 120 | $180,000 | $1,500 | ≈ 2.5% | ≈ $3,880 | ≈ 2.6 | ≈ 16 months |
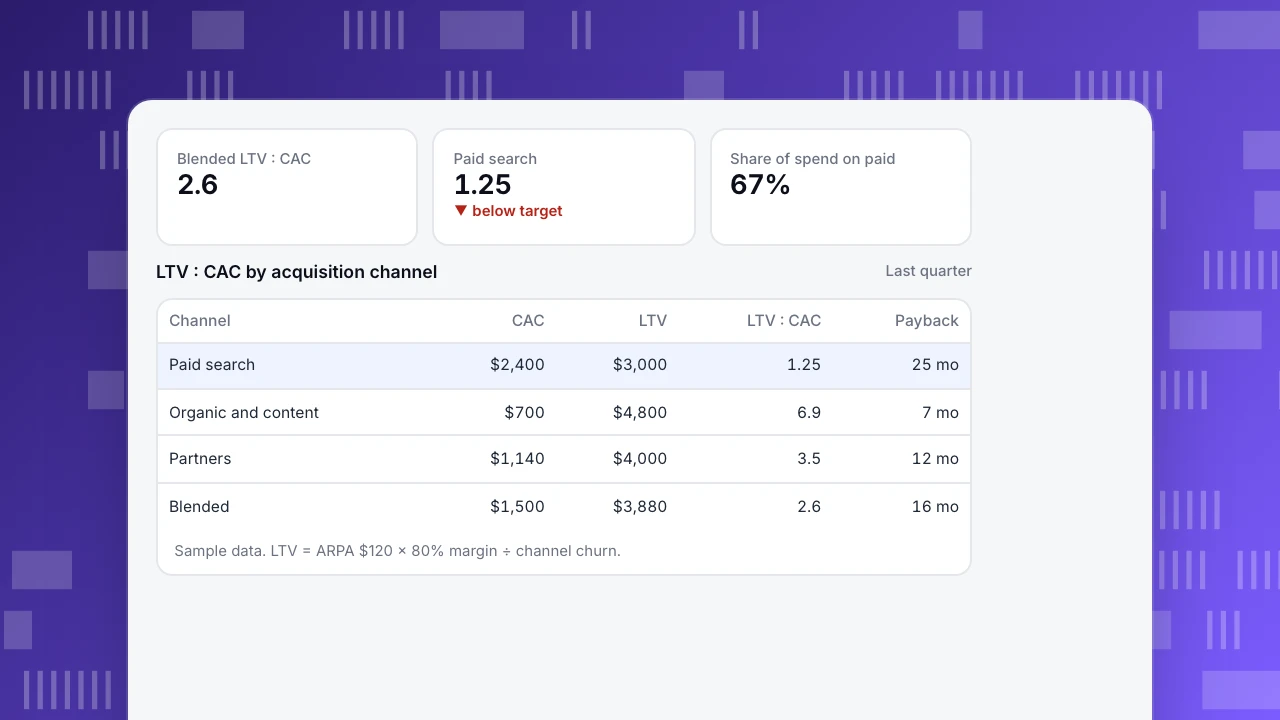
Two-thirds of the spend goes to the channel with the worst ratio. Paid search customers also churn faster, which compounds the problem: they cost more and stay less. The decision is not "stop paid search", but to fix it (tighter keywords, better landing pages, qualifying leads) and fund content and partners more, which scale more slowly.
This channel split needs two things joined per customer: the channel that acquired them (from UTM parameters and first-touch source) and their revenue over time. Without it, blended numbers hide where money is lost.
Blended LTV : CAC
2.6
Paid search
1.25
▼ below target
Share of spend on paid
67%
LTV : CAC by acquisition channel
Last quarter| Channel | CAC | LTV | LTV : CAC | Payback |
|---|---|---|---|---|
| Paid search | $2,400 | $3,000 | 1.25 | 25 mo |
| Organic and content | $700 | $4,800 | 6.9 | 7 mo |
| Partners | $1,140 | $4,000 | 3.5 | 12 mo |
| Blended | $1,500 | $3,880 | 2.6 | 16 mo |
Sample data. LTV = ARPA $120 × 80% margin ÷ channel churn.
What is a good LTV to CAC ratio?
| Ratio | What it usually means |
|---|---|
| Below 1 | Losing money on every customer. Stop scaling, fix retention or acquisition. |
| 1 to 3 | Customers pay back, but margins after other costs are thin. Common for early or paid-heavy companies. |
| Around 3 | The widely used target for venture-backed SaaS, popularized by David Skok. |
| Above 5 | Very efficient; possibly under-investing in growth. Test spending more. |
Pair the ratio with CAC payback period. Skok's rule of thumb is payback under 12 months. A 3:1 ratio with a 30-month payback ties up a lot of cash.
| Ratio | What it usually means |
|---|---|
| Below 1 | Losing money on each customer |
| 1 to 3 | Paying back, thin margins |
| Around 3 | Common SaaS target |
| Above 5 | Possibly under-investing in growth |
Check CAC payback too: under 12 months is a common rule of thumb.
Common mistakes
- Using revenue instead of gross margin for LTV. At 80% margin that alone inflates the ratio by 25%.
- Excluding salaries from CAC. Sales headcount is usually the biggest acquisition cost in B2B.
- Assuming churn never changes. Early cohorts churn faster; very low churn gives absurd lifetimes. Many teams cap the lifetime at 3–5 years or use cohort-based LTV.
- Ignoring expansion revenue. If accounts grow, net revenue retention above 100% makes simple LTV too conservative. Use revenue churn rather than logo churn for a better estimate.
- Timing mismatch. Spend this quarter often produces customers next quarter in long sales cycles; lag CAC accordingly.
- Only blended numbers. As the example shows, the average hides losing channels.
- Treating it as a growth target. The ratio rises if you cut acquisition spend, even as growth stalls.
How to improve LTV : CAC
Raise LTV: reduce early churn with better onboarding, encourage annual plans, expand accounts (seats, usage tiers), and raise prices for value delivered. Track ARPPU and retention by cohort.
Lower CAC: shift budget toward efficient channels, improve landing page conversion, qualify leads earlier, invest in content and referral loops that compound.
Tracking the inputs with TapCub
- Channel of acquisition: TapCub assigns every session a channel and keeps UTM campaign data; tie sign-ups to their first-touch source with goals.
- Revenue per customer: send payments and renewals as server-side events with an order id, and view revenue and paying users in the growth reports.
- Retention by channel: build retention cohorts and break them down by the acquisition channel to get churn per channel.
- The join: use SQL queries to combine first-touch channel and revenue per person, then add cost data from ad platforms and your finance system.
See also: Unit economics, Burn multiple, SaaS marketing.
Sources
- Skok, D. SaaS metrics 2.0: a guide to measuring and improving what matters. For Entrepreneurs.
- Gupta, S. and Lehmann, D. R. (2003). Customers as assets. Journal of Interactive Marketing, 17(1), 9–24.
- Fader, P. (2020). Customer Centricity, 2nd ed. Wharton School Press.
Was this article helpful?
We use your answers to fix and expand this page.
Couldn’t send. Please try again in a minute.
Thanks for the feedback. We’ll use it to improve this page.You’ve already sent feedback on this page. Thanks.

Data Engineer
Writes about event design, data quality, and collection workflows, with verifiable implementation methods for reliable analytics.