Try it on your own data
Every report in this article is in the free plan. One snippet for web and apps, up to 10 sites.
Start freeIn SaaS, the first payment is the start of the story. Marketing is judged on how fast a customer pays back what it cost to win them and how long they stay. This guide covers the funnel, the strategies and the metrics, with a worked quarter where the cheapest-looking channel was not the one to cut.
What you will learn
What is SaaS marketing?
SaaS marketing is the set of strategies a software-as-a-service company uses to attract, convert and keep subscribers. It differs from marketing a one-off product in three ways:
- Revenue arrives monthly. A customer who pays $120 a month is worth nothing on day one and a lot after two years, so marketing is judged on payback and lifetime value, not on the first sale.
- The product is part of the funnel. Free trials, freemium plans and self-serve onboarding mean the product itself converts and retains.
- Retention is a marketing problem. If 4% of customers cancel every month, about 39% of a cohort is gone within a year. Acquisition that ignores churn fills a leaky bucket.
The SaaS marketing funnel
| Stage | Goal | Typical metric |
|---|---|---|
| Awareness | Be found by people with the problem | Organic sessions, share of search, AI-referred visits |
| Acquisition | Turn visitors into signups or leads | Visitor-to-signup rate, cost per signup |
| Activation | Get new users to the first value moment | Activation rate, time to value |
| Conversion | Turn trials or free users into paying customers | Trial-to-paid rate, CAC |
| Retention | Keep paying customers | Logo churn, net revenue retention |
| Expansion and referral | Grow accounts and get recommended | Expansion MRR, referral signups |
Most SaaS teams over-invest in the top two rows and under-measure the bottom three, where revenue is actually decided.
SaaS marketing strategies that work
- Content and SEO for problem-aware searches. Comparison pages, how-to guides, templates and glossaries compound over time. The cost is mostly people, and a good article keeps bringing signups years later.
- Product-led acquisition. A free plan or trial with a fast path to value. The product page is the demo.
- Paid search on high-intent terms. Competitor alternatives, "[category] software" and pricing searches. Costly per click, but close to purchase.
- Paid social for reach and retargeting. LinkedIn for B2B targeting by role and company size; usually expensive per customer, so judge it on deal size too.
- Partnerships and integrations. Marketplace listings, co-marketing with tools your customers already use, agency and reseller programs.
- Referral programs. Reward customers for introductions. Referred customers often convert and retain better because they come with context.
- Lifecycle email and in-app messaging. Onboarding sequences, feature announcements and win-back campaigns are the cheapest growth lever for an existing user base.
- Community and events. Webinars, user groups and forums build trust that ads cannot.
SaaS marketing metrics
- CAC (customer acquisition cost): sales and marketing spend ÷ new customers in the period.
- CAC payback: CAC ÷ (monthly revenue per customer × gross margin). Under 12 months is a common target for SMB SaaS.
- LTV:CAC: lifetime gross profit per customer ÷ CAC. A ratio around 3:1 is the usual benchmark.
- Trial-to-paid conversion: paid customers ÷ trials started.
- Net revenue retention (NRR): revenue from a cohort now ÷ revenue from that cohort a year ago, including expansion and churn.
- Channel mix: share of new customers and revenue by source.
| Metric | Formula |
|---|---|
| CAC | Spend ÷ new customers |
| CAC payback | CAC ÷ (ARPA × gross margin) |
| LTV:CAC | Lifetime gross profit ÷ CAC |
| Trial-to-paid | Paid ÷ trials started |
| NRR | Cohort revenue now ÷ a year ago |
Benchmarks: LTV:CAC ≈ 3:1, payback under 12 months.
Worked example: comparing channels by payback, not CAC
A B2B SaaS company spent $96,000 on four channels in one quarter. Average revenue per account is $120 a month, gross margin 80%, so each customer contributes $96 a month of gross profit (sample figures):
| Channel | Spend | Signups | New customers | Signup → paid | CAC | Payback |
|---|---|---|---|---|---|---|
| Content and SEO | $24,000 | 1,800 | 108 | 6.0% | $222 | 2.3 months |
| Google Ads | $36,000 | 1,200 | 60 | 5.0% | $600 | 6.3 months |
| LinkedIn Ads | $30,000 | 400 | 16 | 4.0% | $1,875 | 19.5 months |
| Partners and referrals | $6,000 | 300 | 27 | 9.0% | $222 | 2.3 months |
| Total | $96,000 | 3,700 | 211 | 5.7% | $455 | 4.7 months |
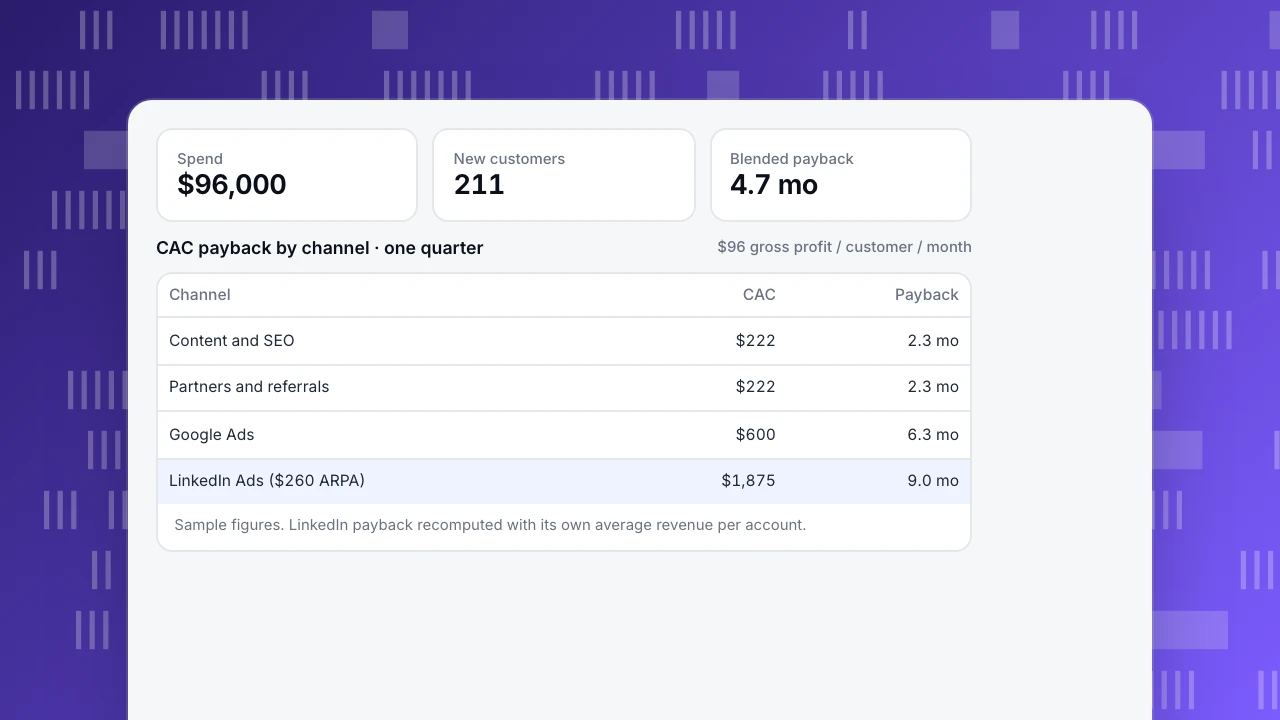
On CAC alone, LinkedIn looks like the channel to cut. But when the team joined revenue to the source of each account, LinkedIn customers paid $260 a month on average (larger companies on higher plans). Their payback is $1,875 ÷ ($260 × 0.8) = 9.0 months, inside the 12-month target. The real finding was elsewhere: partner customers had the lowest churn (1.8% a month against 3.5% overall), so the partner program, at $6,000, got the next quarter's budget increase.
The lesson: compare channels on payback and retention by cohort, which requires tying signups and payments back to their original source.
Spend
$96,000
New customers
211
Blended payback
4.7 mo
CAC payback by channel · one quarter
$96 gross profit / customer / month| Channel | CAC | Payback |
|---|---|---|
| Content and SEO | $222 | 2.3 mo |
| Partners and referrals | $222 | 2.3 mo |
| Google Ads | $600 | 6.3 mo |
| LinkedIn Ads ($260 ARPA) | $1,875 | 9.0 mo |
Sample figures. LinkedIn payback recomputed with its own average revenue per account.
Common SaaS marketing mistakes
- Optimizing for signups. Cheap signups that never activate raise CAC per paying customer.
- Last-click only. A buyer may read three articles, see a LinkedIn ad and then search your brand. Brand search gets all the credit.
- Ignoring churn by channel. Two channels with the same CAC can differ twice over in lifetime value.
- Blended CAC hides bad channels. Report CAC and payback per channel and per plan.
- No source on the account. If the original source is not stored with the customer record, revenue cannot be traced back to marketing later.
Tracking SaaS marketing in TapCub
TapCub records the source, UTM parameters and ad click IDs of each visit (Sources and UTM). Identify users at signup so later trials and payments join the same person (Identify users), then build a funnel from visit to signup to payment (Build a funnel) and break it down by channel. In All-platform analytics › Business › Channel ROI, import spend per channel and campaign to see cost per acquisition and return on ad spend next to sessions, conversions and revenue. For the formulas, see LTV to CAC ratio and SaaS metrics.
See also: User acquisition, SEO for startups, Freemium model.
Sources
- David Skok, SaaS Metrics 2.0: a guide to measuring and improving what matters (For Entrepreneurs): LTV:CAC and CAC payback benchmarks.
Was this article helpful?
We use your answers to fix and expand this page.
Couldn’t send. Please try again in a minute.
Thanks for the feedback. We’ll use it to improve this page.You’ve already sent feedback on this page. Thanks.

Growth Strategist
Explores acquisition channels, activation, and conversion experiments, turning data insights into actionable growth hypotheses and evaluation methods.