Try it on your own data
Every report in this article is in the free plan. One snippet for web and apps, up to 10 sites.
Start freeThe SaaS customer journey runs from awareness through activation and payment to retention and expansion, and it is a loop, not a funnel. This guide defines eight stages with goals and metrics, explains how to measure them with identity and account data, and follows a trial cohort where activation in the first week decided almost every paid account.
What you will learn
- Treat the journey as a loop, not a funnel
- Define each stage as an observable event
- Identify users at sign-up to join the journey
- Analyze B2B journeys at the account level
- Activation usually decides conversion
What is the SaaS customer journey?
The SaaS customer journey is the path a business or person takes from first hearing about a software product to becoming a paying, retained and ideally expanding customer. Unlike a one-off purchase, a SaaS journey does not end at payment: revenue depends on customers activating, adopting the product, renewing every month or year, and often upgrading. The journey is therefore a loop, not a funnel.
Mapping it with measurable stages lets a team see whether growth problems sit in acquisition, activation, retention or expansion, and assign each to an owner.
The stages of the SaaS customer journey
| Stage | Customer goal | Company goal | Key metric |
|---|---|---|---|
| Awareness | Recognize a problem, discover options | Be found for the problem | Organic and referral visitors, branded search |
| Consideration | Compare solutions, check fit and price | Show fit and proof | Pricing page visits, demo requests, trial starts |
| Activation | Get first value quickly | Deliver the aha moment | Activation rate, time to value |
| Adoption | Use the product in daily work | Build habit and depth | Weekly active users, feature adoption |
| Conversion | Decide to pay | Convert trial or free users | Trial-to-paid, free-to-paid rate |
| Retention | Keep getting value | Prevent churn | Logo and revenue churn, net revenue retention |
| Expansion | Use more seats, higher plans | Grow account value | Expansion MRR, upgrade rate |
| Advocacy | Recommend to others | Turn customers into a channel | Referrals, reviews, NPS |
Product-led products usually have activation before conversion (free plan or trial). Sales-led products insert qualification, demos and procurement between consideration and conversion.
| Stage | Owner |
|---|---|
| Awareness, consideration | Marketing |
| Activation, adoption | Product |
| Conversion | Product or sales |
| Retention, expansion | Customer success |
Each owner reports on the metric for their stage.
How to map and measure the journey
1. Define each stage as an observable event
"Activated" might mean "created a project and invited a teammate within 7 days". Vague stage definitions produce vague dashboards.
2. Connect anonymous and identified data
Visitors become sign-ups become accounts. Identify users at sign-up so marketing touchpoints and in-product behavior join into one journey.
3. Measure stage-to-stage conversion and time
For each cohort of sign-ups, measure how many reach each stage and how long it takes. Time between stages is often more revealing than the rate.
4. Analyze at the account level for B2B
In B2B, accounts buy, not individual users. Group users into accounts to see team adoption, seats and expansion.
5. Assign owners
Marketing owns awareness and consideration, product owns activation and adoption, customer success owns retention and expansion. Each owner reports on their stage's metric.
Worked example: where a SaaS loses revenue
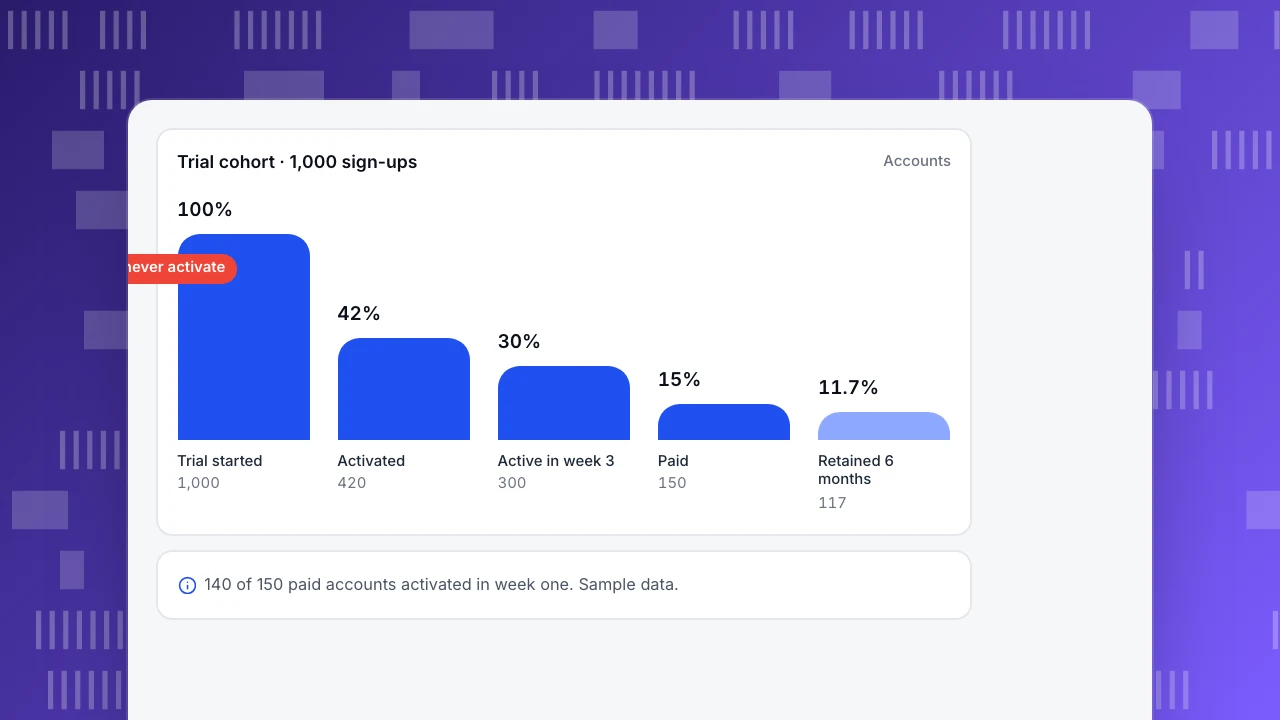
A project management SaaS (sample data) follows a monthly cohort of 1,000 trial sign-ups:
| Stage | Accounts | Stage rate | Median time |
|---|---|---|---|
| Trial started | 1,000 | — | — |
| Activated (project + teammate invited) | 420 | 42% | 2 days |
| Weekly active in week 3 | 300 | 71% of activated | — |
| Converted to paid | 150 | 50% of week-3 active | 16 days |
| Retained after 6 months | 117 | 78% | — |
| Expanded (more seats) | 35 | 30% of retained | 4 months |
Only 42% of trials activate, and almost no unactivated account ever pays: 140 of the 150 paid accounts activated in the first week. Raising activation from 42% to 50% (for example with templates and an invite prompt during setup) would add about 28 paying accounts per cohort at the same downstream rates, more than any change to pricing or ads.
Trial cohort · 1,000 sign-ups
AccountsTrial started
1,000
Activated
420
Active in week 3
300
Paid
150
Retained 6 months
117
Common mistakes
- Ending the journey at payment. Most SaaS revenue comes after the first invoice.
- Optimizing sign-ups instead of activation. More trials that never activate do not become revenue.
- User-level metrics for B2B. Accounts, not individual users, renew and expand.
- No identity resolution. Without linking visitors to accounts, you cannot see which channels bring customers who stay.
- One owner for everything. Each stage needs an accountable team.
Measuring the SaaS customer journey in TapCub
- Identity: identify users at sign-up so pre-sign-up visits and in-app behavior join; analyze accounts with groups for B2B.
- Journey maps and funnels: define stages from pages and events in journey maps, with reach and movement per stage; build trial-to-paid funnels.
- Retention and lifecycle: cohort retention, lifecycle (new, returning, resurrecting, dormant).
- Revenue: server-side events for subscriptions and renewals; see subscription analytics.
- Support: live chat linked to the visitor's pages and account.
Related: SaaS metrics, product-led growth metrics, activation rate, net revenue retention.
FAQ
What are the stages of the SaaS customer journey? Awareness, consideration, activation, adoption, conversion, retention, expansion and advocacy. Product-led products activate users before they pay; sales-led products add qualification and demos.
How is the SaaS customer journey different from ecommerce? SaaS revenue is recurring, so retention and expansion after the first payment matter as much as acquisition.
Which stage matters most? Usually activation: users who do not reach the product's core value early rarely convert or stay.
Who should own the customer journey? Each stage should have an owner (marketing, product, customer success), with a shared view of the whole journey.
Sources
- Skok, D. SaaS metrics 2.0: a guide to measuring and improving what matters. For Entrepreneurs.
- OpenView. Product-led growth.
Was this article helpful?
We use your answers to fix and expand this page.
Couldn’t send. Please try again in a minute.
Thanks for the feedback. We’ll use it to improve this page.You’ve already sent feedback on this page. Thanks.

Data Engineer
Writes about event design, data quality, and collection workflows, with verifiable implementation methods for reliable analytics.