Try it on your own data
Every report in this article is in the free plan. One snippet for web and apps, up to 10 sites.
Start freeYour billing system shows how much recurring revenue you have. Subscription analytics explains why it changes, by joining revenue with who subscribers are and how they use the product. This guide lists the metrics with formulas, shows where the data comes from, and walks through a 12-month cohort with three findings billing alone would have missed.
What you will learn
- Report MRR movements, not only the total
- Track NRR and GRR to see what existing customers do
- Join billing and usage data with a shared subscriber ID
- Low usage in month 2 can predict churn
- Separate involuntary churn from failed payments
What is subscription analytics?
Subscription analytics is the measurement of how a subscription business acquires, keeps, expands and loses recurring revenue. It covers revenue metrics such as MRR, churn and net revenue retention, and, increasingly, the product usage behind them: which subscribers use the product, which are about to leave, and which are ready to upgrade.
A billing system can tell you what happened to revenue. Subscription analytics joins that with who the subscribers are and what they do, so you can explain the numbers and act before they move.
Key subscription metrics
| Metric | Formula | Watch for |
|---|---|---|
| MRR / ARR | Sum of normalized monthly (or annual) recurring revenue | Growth and its components |
| Active subscribers | Paying subscriptions at period end | Mix by plan and billing interval |
| ARPU / ARPA | MRR ÷ subscribers (or accounts) | Pricing and upgrade effects |
| Logo churn rate | Subscribers lost ÷ subscribers at start | Who leaves |
| Revenue churn rate | MRR lost to cancellations and downgrades ÷ starting MRR | What leaving costs |
| Net revenue retention (NRR) | (Starting MRR + expansion − contraction − churn) ÷ starting MRR | Whether existing customers grow |
| Gross revenue retention (GRR) | (Starting MRR − contraction − churn) ÷ starting MRR | Revenue kept before upsells |
| Trial-to-paid conversion | Paid ÷ trials started | Acquisition quality |
| Involuntary churn | Subscriptions ended by unrecovered failed payments | Billing hygiene |
| Customer lifetime value | ARPU × gross margin ÷ churn rate | Affordable acquisition cost |
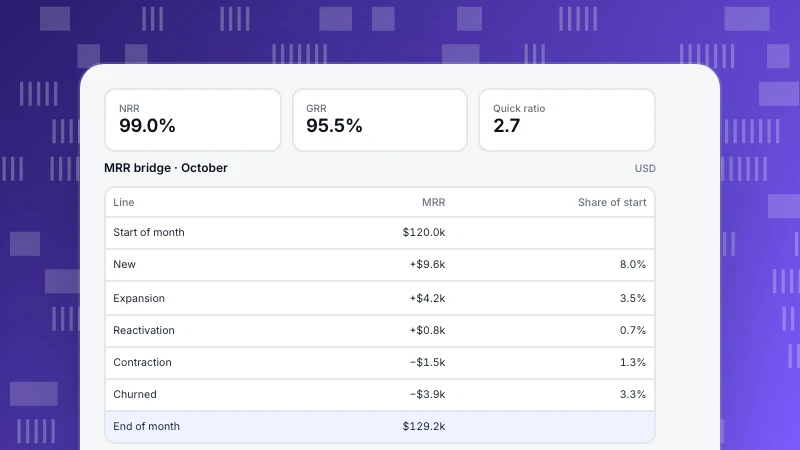
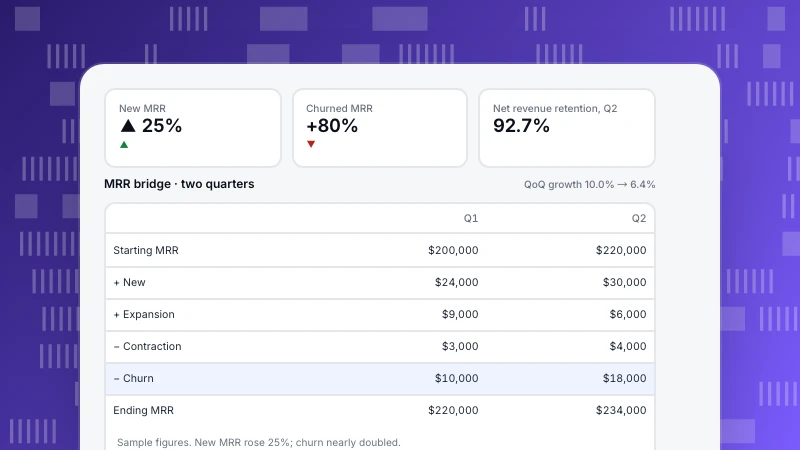
Always report MRR movements, not just the total: new, expansion, contraction, churned and reactivated MRR explain why the total changed.
| Metric | Formula |
|---|---|
| NRR | (Start + expansion − contraction − churn) ÷ start |
| GRR | (Start − contraction − churn) ÷ start |
| Revenue churn | MRR lost ÷ starting MRR |
| ARPU | MRR ÷ subscribers |
| LTV | ARPU × margin ÷ churn rate |
Normalize annual plans to monthly MRR.
Where the data comes from
- Billing system (Stripe, Paddle, Chargebee, App Store, Google Play): subscriptions, invoices, plan changes, refunds, failed payments.
- Product analytics: logins, feature use, seats used, key actions.
- CRM and support: account owner, segment, tickets, NPS.
The most valuable analysis happens where these meet: usage by plan, churn by activity level, expansion by feature adopted. That requires a shared identifier, the subscriber or account ID, on both billing and product events.
Worked example: what twelve months of subscription data showed
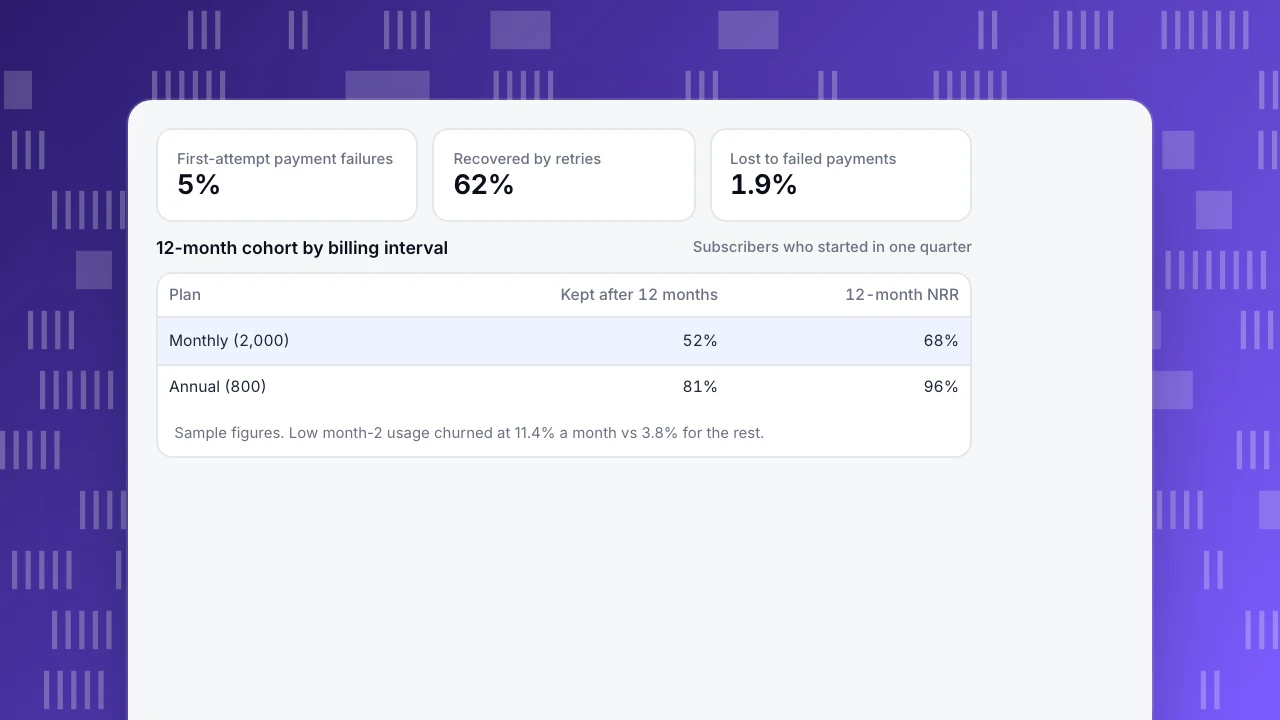
A SaaS product with monthly and annual plans analyzed subscribers who started in one quarter and followed them for 12 months (sample figures):
| Plan | Subscribers at start | Still subscribed after 12 months | 12-month NRR |
|---|---|---|---|
| Monthly | 2,000 | 1,040 (52%) | 68% |
| Annual | 800 | 648 (81%) | 96% |
Three findings came from joining billing with usage:
- Usage in month 2 predicted churn. Monthly subscribers with fewer than 2 active days a week in their second month churned at 11.4% a month, against 3.8% for the rest, three times higher. The team started an outreach program for that group in week 6.
- Involuntary churn was larger than expected. 5% of monthly renewals failed on the first payment attempt; automatic retries and card-update emails recovered 62% of them, leaving 1.9% of renewals lost to payment failure. With monthly churn around 5.3%, that was more than a third of it, and none of it was in the cancellation survey.
- Annual plans were not only stickier because of the contract. Annual subscribers used the product more from week 1, so part of the difference was selection. Offering annual billing to engaged monthly subscribers in month 3 moved 14% of them to annual without a discount deeper than the existing one.
First-attempt payment failures
5%
Recovered by retries
62%
Lost to failed payments
1.9%
12-month cohort by billing interval
Subscribers who started in one quarter| Plan | Kept after 12 months | 12-month NRR |
|---|---|---|
| Monthly (2,000) | 52% | 68% |
| Annual (800) | 81% | 96% |
Sample figures. Low month-2 usage churned at 11.4% a month vs 3.8% for the rest.
How to set up subscription analytics
- Define metrics once: what counts as MRR (exclude one-off fees, normalize annual plans to monthly), when a subscription is churned (at cancellation or at period end).
- Send subscription events from the server: started, renewed, upgraded, downgraded, cancelled, payment failed, payment recovered, with plan and amount.
- Identify subscribers in the product with the same ID used in billing.
- Build the MRR bridge monthly: new, expansion, contraction, churn, reactivation.
- Track cohorts by start month, plan and acquisition channel, for logo and revenue retention.
- Add usage health: active days, key feature use, seats used, as leading indicators for churn and expansion.
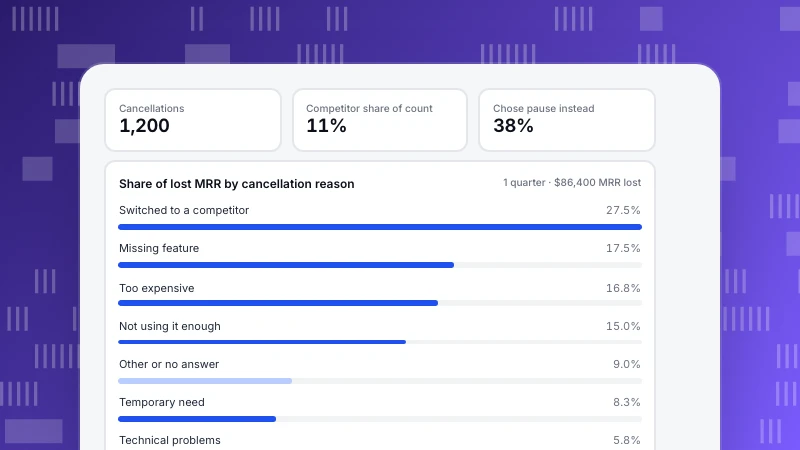
- Separate voluntary and involuntary churn, and record cancellation reasons for the voluntary part.
Common mistakes
- Counting annual payments as one month's MRR. Normalize to monthly.
- Reporting only blended churn. Monthly and annual plans behave very differently.
- Ignoring failed payments. Involuntary churn is often the easiest revenue to recover.
- Analyzing billing without usage. You see who left, not why or who is next.
- Client-side revenue events. Ad blockers and closed tabs lose them; send billing events from the server.
Subscription analytics in TapCub
Send subscription events from your server (Send server-side events) and identify subscribers with the same user ID as in billing (Identify users). The B2B / SaaS industry pack under All-platform analytics › Business › Industry packs defines events such as trial_started, subscription_started (with plan and mrr), subscription_upgraded, payment_succeeded and subscription_cancelled, and adds metrics for new, expansion and churned MRR, subscription churn rate and trial conversion, plus SaaS growth and product adoption dashboards. Group accounts to analyze at company level (Analyze accounts with groups). Related reading: SaaS metrics, Revenue growth rate and Cancellation reasons.
Sources
- Stripe documentation, Smart Retries: recovering failed subscription payments.
Was this article helpful?
We use your answers to fix and expand this page.
Couldn’t send. Please try again in a minute.
Thanks for the feedback. We’ll use it to improve this page.You’ve already sent feedback on this page. Thanks.

Data Engineer
Writes about event design, data quality, and collection workflows, with verifiable implementation methods for reliable analytics.