Try it on your own data
Every report in this article is in the free plan. One snippet for web and apps, up to 10 sites.
Start freeChurn prediction is only useful if it flags the right customers early enough to act. This guide covers the signals that predict churn, a rule-based way to start, and a worked example of judging a prediction by precision, recall and lift at the capacity your team really has.
What you will learn
- Usage trends, not demographics, are usually the strongest churn signals
- Start with two or three rules tested on past data; a model has to beat them
- Judge a prediction by precision and recall at your outreach capacity, not by accuracy
What is churn prediction?
Customer churn prediction estimates which customers are likely to cancel, stop buying or not renew within a set period, such as the next 60 days, so you can act while there is still time. The output is usually a ranked list or a risk score per customer.
The point is not the prediction; it is the action. A model that flags 500 accounts when your team can call 50 is no help.
Signals that predict churn
Behaviour almost always predicts better than demographics. The table below lists the signals that matter most in SaaS and subscription businesses.
| Signal | Example | Why it predicts churn |
|---|---|---|
| Usage trend | Active days down 50% vs previous 30 days | Falling use usually comes before cancelling |
| Core feature use | No report viewed in 14 days | The product stopped doing its job |
| Breadth | Only 1 of 5 seats active | Value depends on one person |
| Onboarding | Never reached first value | Customers who never activated rarely stay |
| Support | Several unresolved tickets | Frustration builds up |
| Billing | Failed payment, downgrade | Direct sign of risk |
| Tenure and plan | Monthly plan, under 90 days | Early customers and monthly plans churn more |
Combine two or three signals; any single one has many false alarms.
Start with rules, not a model
Before any machine learning, write two or three rules from what your team already knows and test them on past data:
- Active days in the last 30 dropped by more than half compared with the previous 30.
- No use of the core feature in 14 days.
- Seats used fell below half of seats paid for.
Flag accounts matching two or more rules. If this catches most churners, you may not need a model. If not, the rules become your baseline to beat. A customer health score is a structured version of the same idea.
A worked example: judging a prediction
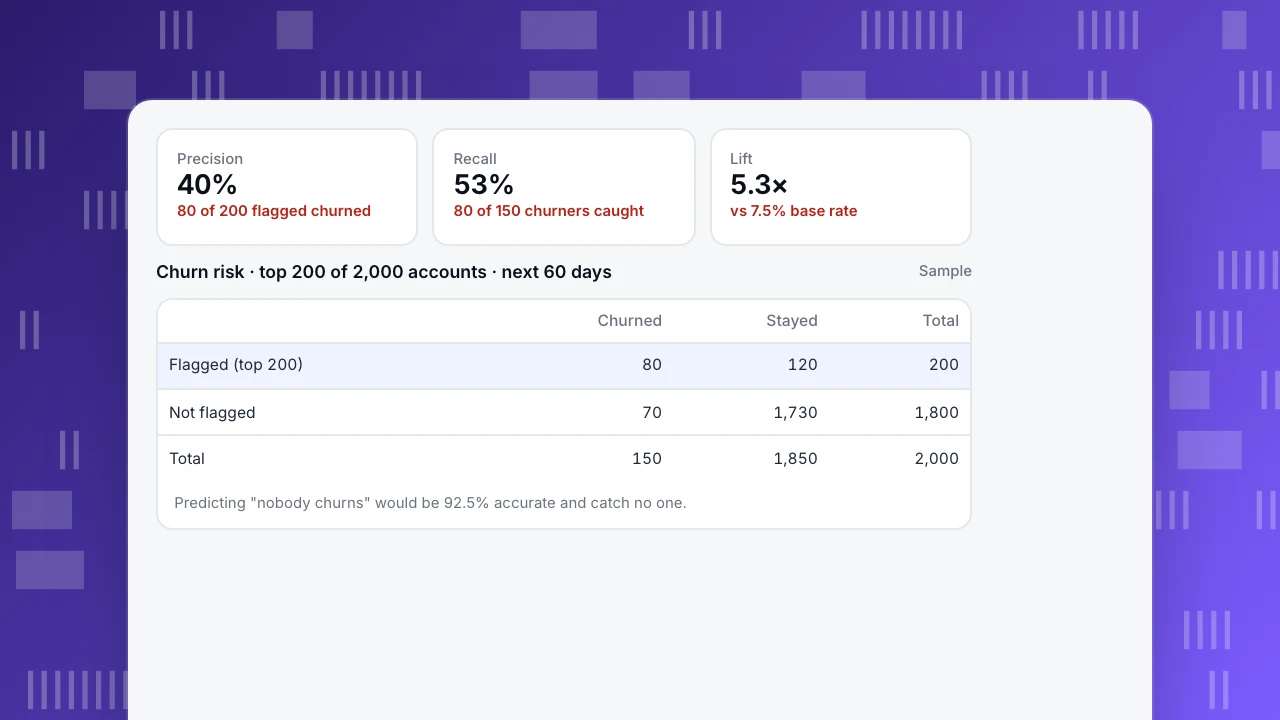
A SaaS company scores 2,000 active accounts at the start of a quarter. Over the next 60 days, 150 of them churn, a base rate of 7.5% (sample numbers). The customer success team can contact 200 accounts, so the top 200 scores are flagged.
- 80 of the 200 flagged accounts churned: precision 40%.
- 80 of all 150 churners were in the flagged list: recall 53%.
- A random 200 would contain about 15 churners (7.5%); the model's 40% is 5.3 times the base rate.
Judge the model at the capacity you actually have. Overall accuracy is misleading here: predicting "nobody churns" is 92.5% accurate and useless.
Precision
40%
80 of 200 flagged churned
Recall
53%
80 of 150 churners caught
Lift
5.3×
vs 7.5% base rate
Churn risk · top 200 of 2,000 accounts · next 60 days
Sample| Churned | Stayed | Total | |
|---|---|---|---|
| Flagged (top 200) | 80 | 120 | 200 |
| Not flagged | 70 | 1,730 | 1,800 |
| Total | 150 | 1,850 | 2,000 |
Predicting "nobody churns" would be 92.5% accurate and catch no one.
Moving to a model
When rules are not enough:
- Define churn precisely: cancelled, not renewed, or no purchase in 90 days.
- Build features per customer from the last 30–90 days: active days, core actions, trend versus the previous period, seats, support contacts, plan, tenure.
- Use past data where you know the outcome. Train on older months, test on the most recent.
- Start with logistic regression or gradient-boosted trees. They are easy to explain and hard to beat on tabular data.
- Check precision and recall at your capacity, and compare with the rule baseline.
- Act and measure. Contact half the flagged accounts and hold out the other half, to see whether outreach actually saves customers.
Common mistakes
- Leakage: using signals that only appear after the decision, such as a cancellation page visit.
- Predicting too late: a score that rises the week before renewal leaves no time.
- No action plan: a list with no owner changes nothing.
- Never retraining: product changes alter what normal usage looks like.
See customer churn analysis for understanding why customers left after the fact.
Building the inputs with TapCub
TapCub does not include a churn model, but it gives you the behavioural inputs. Identify users when they log in and attach events to accounts, so All-platform analytics › Users › Accounts shows activity per company. Build segments for your rules in All-platform analytics › Users › Segments & tags, such as "no core action in 14 days"; segments recompute daily, so the list stays current. Compare retention by plan or sign-up cohort to see which groups churn earlier, and set a monitor on the size of an at-risk segment. For a model, combine these per-account counts with billing data in your own notebook or warehouse.
Was this article helpful?
We use your answers to fix and expand this page.
Couldn’t send. Please try again in a minute.
Thanks for the feedback. We’ll use it to improve this page.You’ve already sent feedback on this page. Thanks.

Data Engineer
Writes about event design, data quality, and collection workflows, with verifiable implementation methods for reliable analytics.