Try it on your own data
Every report in this article is in the free plan. One snippet for web and apps, up to 10 sites.
Start freeCustomer churn analysis answers three questions: who leaves, when they leave, and what they did, or did not do, before leaving. You do not need a prediction model to start. This guide gives a five-step method that works with ordinary event data, the signals to compare, and a sample that ends in a concrete fix.
What you will learn
- Define churn precisely before measuring it: cancellation, non-renewal or inactivity
- Measure churn by cohort and find the period when most people leave
- Compare what churned and retained customers did in their first weeks, then act on the biggest gap
What churn analysis is for
Churn analysis looks back at customers who left to find patterns you can act on. It answers:
- Who churns: which plans, channels, sizes or segments.
- When they churn: in which week or month of their life.
- After what: which behaviour, or missing behaviour, comes before leaving.
Churn rate tells you how much. Churn analysis tells you why and where to intervene.
Step 1: Define churn
Pick one definition and write it down:
- Subscription: cancelled, or did not renew at the end of the term.
- Usage: no activity for a set number of days, such as 30.
For usage-based products, choose the inactivity window from your normal usage rhythm. A weekly tool might use 14 days; a monthly reporting tool, 45.
Step 2: Measure by cohort
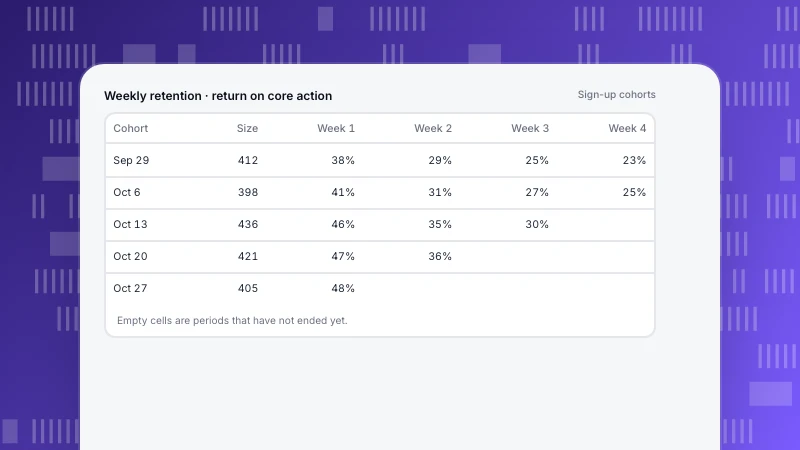
Group customers by the month they started and track what share is still active each month. A single blended rate hides whether newer cohorts are better or worse than older ones. See retention metrics for the curve.
Step 3: Find when churn happens
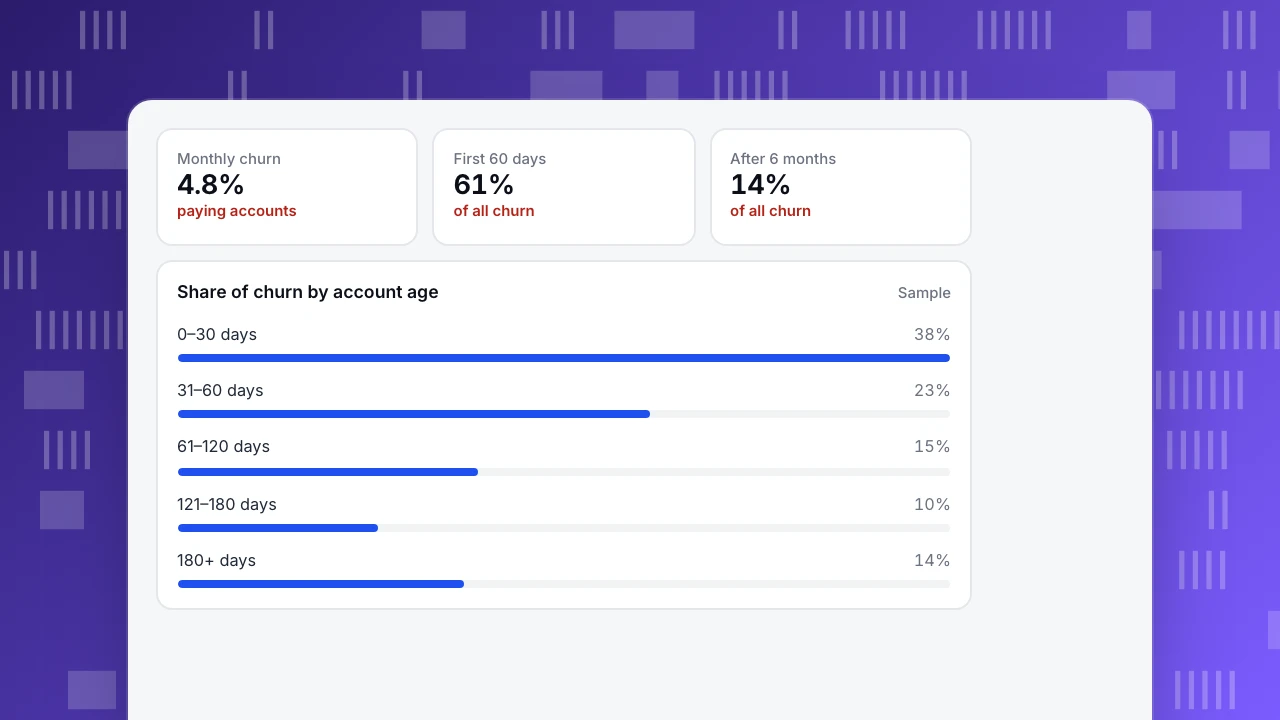
Split churned accounts by how old they were when they left, and see what share of all churn each age band holds.
A worked example
A subscription software team sees monthly churn of 4.8%. Splitting churn by account age shows 61% of it happens in the first 60 days. That points to onboarding, not price or competition.
Monthly churn
4.8%
paying accounts
First 60 days
61%
of all churn
After 6 months
14%
of all churn
Share of churn by account age
SampleStep 4: Compare churned and retained behaviour
Take the accounts that churned in their first 60 days and the ones that stayed, and compare what each group did in week one. In the sample, the biggest gaps are finishing setup and using the core feature three or more times. Visiting the billing page late in life is a warning sign rather than a cause.
The table shows the comparison. A gap is a lead, not proof: confirm it with a change and a test.
| Signal | Retained customers | Churned customers |
|---|---|---|
| Finished setup in week 1 | 82% | 41% |
| Used the core feature 3+ times | 74% | 22% |
| Invited a teammate | 58% | 12% |
| Opened a support ticket | 19% | 27% |
| Visited billing page in last 30 days | 8% | 31% |
Sample data from one quarter of new accounts.
Step 5: Act and re-measure
- Pick the largest gap that the team can influence, here using the core feature early.
- Change the product or onboarding to close it, for example a guided first task.
- Compare the next cohorts with earlier ones at the same age.
Tools in TapCub
Retention cohorts can be daily, weekly or monthly. Lifecycle splits each period into new, returning, resurrecting and dormant people, and the inactivity view counts people with no activity for 7, 14, 30, 60 and 90 days, which helps you pick an inactivity definition.
FAQ
What is the difference between churn analysis and churn prediction?
Analysis explains past churn with descriptive data. Prediction scores current customers by their risk of leaving. Start with analysis: it tells you which signals are worth predicting from.
How much data do I need?
Enough churned customers in each group to see a pattern, typically at least a few dozen per segment you compare.
Should I count downgrades as churn?
Track them separately as revenue churn. Customer churn counts people or accounts who leave entirely.
See also: Cancellation reasons.
See also: Customer needs analysis.
See also: Churn prevention: 12 strategies, matched to why customers leave.
Was this article helpful?
We use your answers to fix and expand this page.
Couldn’t send. Please try again in a minute.
Thanks for the feedback. We’ll use it to improve this page.You’ve already sent feedback on this page. Thanks.

Product Analyst
Focuses on event analysis, conversion funnels, and retention, using clear metric definitions and structured analysis to explain product performance.