Try it on your own data
Every report in this article is in the free plan. One snippet for web and apps, up to 10 sites.
Start freeChurn rate and retention rate are usually presented as two sides of one coin. They are, in exactly one situation: one fixed group, one period, one denominator. This guide works through the cases where they stop adding up to 100%, including revenue retention above 100%, and explains which number to report where.
What you will learn
- Churn + retention = 100% only for one fixed group over one period with the same denominator
- Revenue churn and net revenue retention can diverge sharply; report gross and net
- Convert monthly churn to annual by compounding, and split voluntary from involuntary churn
The short answer
Churn rate is the share of customers (or revenue) you lose in a period; retention rate is the share you keep. For one group of customers over one period, churn rate + retention rate = 100%. Outside that one case, the two stop being mirror images, and that is where most confusion about churn rate vs retention rate comes from.
When churn and retention add up
Take the customers you had at the start of the month, and nobody else. At the start there are 400; by the end 40 of them have cancelled. Churn rate = 40 ÷ 400 = 10%; retention rate = 360 ÷ 400 = 90%. They add up because both use the same denominator (customers at the start) and the same group of people.
The customer retention rate formula you often see, (customers at end − new customers) ÷ customers at start, is the same calculation: subtracting new customers removes everyone who was not in the starting group.
When they do not add up
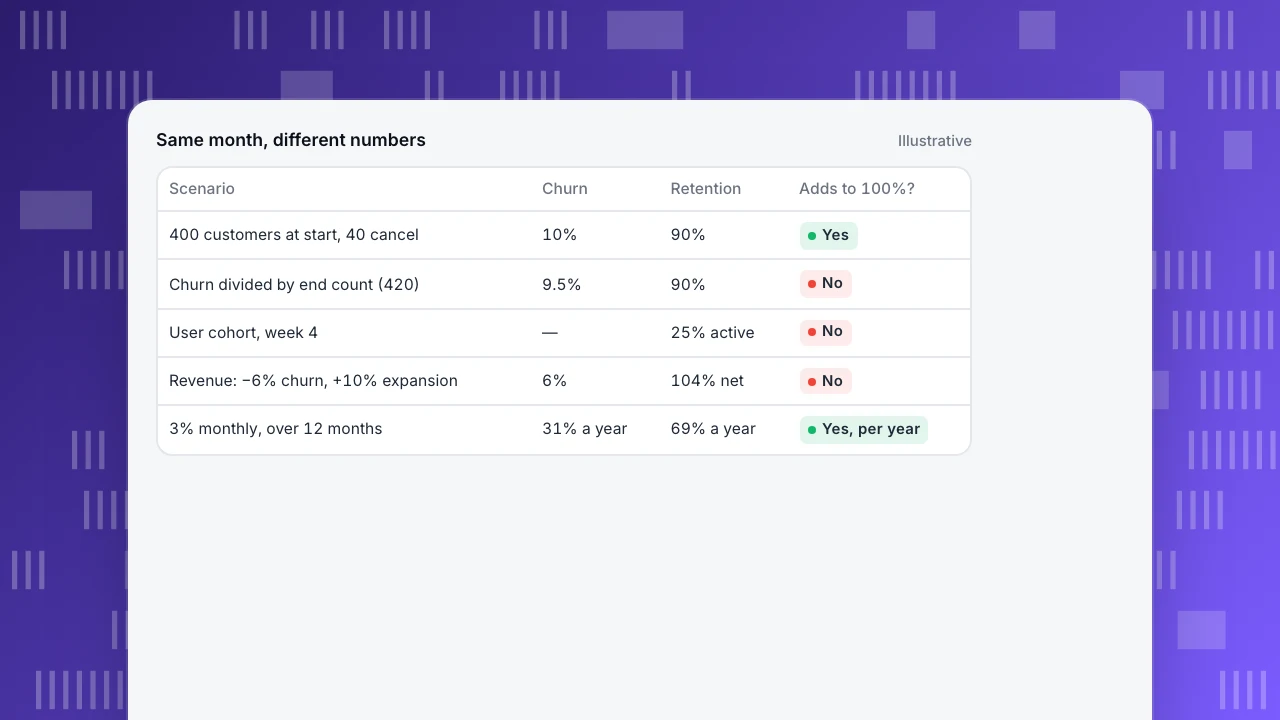
The example table shows four common situations where the numbers you see are not each other's complement:
- Churn on the end count. Some teams divide lost customers by customers at the end of the period, which includes new ones. Churn looks lower, and "100% − churn" overstates retention.
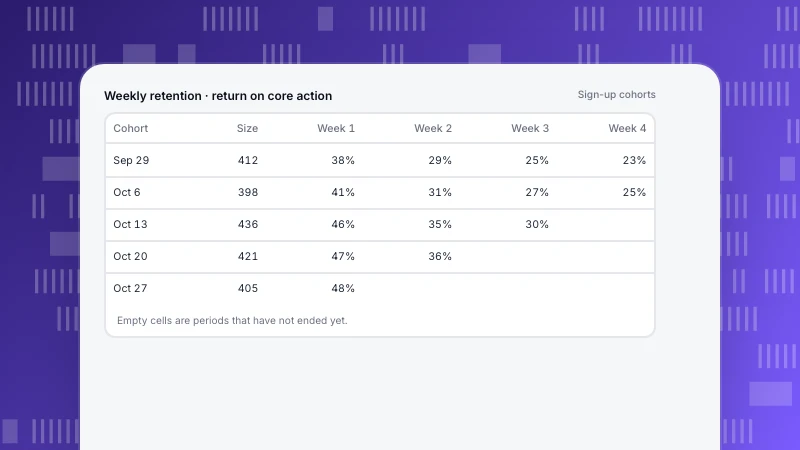
- User cohorts. Week-4 retention of 25% does not mean 75% churned: some users skip week 4 and come back in week 6. People who are inactive are not necessarily gone; see retention metrics for bounded and unbounded counting.
- Revenue with expansion. Revenue churn can be 6% while net revenue retention is 104%, because upgrades from remaining customers outweigh what was lost.
- Different periods. A 3% monthly churn rate is not a 64% annual retention rate; see the section on compounding below.
Same month, different numbers
Illustrative| Scenario | Churn | Retention | Adds to 100%? |
|---|---|---|---|
| 400 customers at start, 40 cancel | 10% | 90% | Yes |
| Churn divided by end count (420) | 9.5% | 90% | No |
| User cohort, week 4 | — | 25% active | No |
| Revenue: −6% churn, +10% expansion | 6% | 104% net | No |
| 3% monthly, over 12 months | 31% a year | 69% a year | Yes, per year |
Revenue churn and net revenue retention
For subscription businesses, revenue usually matters more than customer counts: losing ten small customers is not the same as losing one large one. The table defines the revenue versions.
Gross revenue retention can never exceed 100%; it shows how much existing revenue you keep. Net revenue retention (NRR) adds expansion and can exceed 100%, which means existing customers grow faster than they leave. Report both: a high NRR can hide heavy churn among small customers if a few large accounts expand.
| Metric | Formula | Can exceed 100%? |
|---|---|---|
| Customer churn rate | Customers lost ÷ customers at start | No |
| Revenue churn rate | MRR lost to cancellations and downgrades ÷ MRR at start | No |
| Gross revenue retention | (Start MRR − churn − contraction) ÷ start MRR | No |
| Net revenue retention | (Start MRR − churn − contraction + expansion) ÷ start MRR | Yes |
| Annual churn from monthly | 1 − (1 − monthly churn)¹² | No |
MRR = monthly recurring revenue. Use revenue from existing customers only; exclude new customers.
Monthly vs annual churn
Monthly churn compounds. With a constant monthly churn rate m, annual retention is (1 − m)¹² and annual churn is 1 − (1 − m)¹². A 3% monthly churn means (0.97)¹² ≈ 69% of customers remain after a year, so annual churn is about 31%, not 36%. Convert before comparing a monthly-billing business with an annual-contract one.
Voluntary vs involuntary churn
Split churn by cause. Voluntary churn is a customer deciding to cancel. Involuntary churn is a failed payment or expired card. They need different fixes: product and value for the first, payment retries and reminders for the second. A churn rate that mixes both will lead to the wrong fix.
Which one to report
- On the management dashboard: monthly customer churn, gross revenue retention and net revenue retention.
- For product teams: cohort retention on the core action, because it reacts weeks before customers cancel.
- For forecasting: churn, because LTV is roughly ARPU ÷ churn rate.
Write the denominator and the period next to every number, and the churn and retention definitions in the glossary of your dashboard.
Churn and retention in TapCub
Billing churn comes from your payment system. What TapCub adds is the behaviour that precedes it. Retention analysis shows cohorts by day, week or month on any start and return event. The lifecycle view counts, for each period, people who are new, returning (also active in the previous period), resurrecting (active earlier but not in the previous period) and dormant (active now, absent in the next period); the current unfinished period is not marked dormant (retention and lifecycle).
A growing dormant count among paying accounts is the product-side early warning for churn. The retention calculator helps check the customer formulas above with your own numbers.
FAQ
Is churn rate the opposite of retention rate?
Only for one fixed group of customers over one period, using the same denominator. Then churn + retention = 100%.
How do you calculate churn rate?
Customers lost during the period ÷ customers at the start of the period. Do not include customers acquired during the period.
Can retention be over 100%?
Customer retention cannot. Net revenue retention can, when expansion revenue from existing customers is larger than revenue lost to churn and downgrades.
How do I convert monthly churn to annual churn?
Annual churn = 1 − (1 − monthly churn)¹². At 3% monthly, that is about 31% a year.
Which is better to track, churn or retention?
Track both, with different purposes: churn for forecasting and finance, cohort retention for product decisions, net revenue retention for growth from existing customers.
Was this article helpful?
We use your answers to fix and expand this page.
Couldn’t send. Please try again in a minute.
Thanks for the feedback. We’ll use it to improve this page.You’ve already sent feedback on this page. Thanks.

Product Analyst
Focuses on event analysis, conversion funnels, and retention, using clear metric definitions and structured analysis to explain product performance.