Try it on your own data
Every report in this article is in the free plan. One snippet for web and apps, up to 10 sites.
Start freeA product analytics framework decides what to measure, how metrics relate and which analyses answer which questions. This guide compares North Star, AARRR, HEART, metric trees and jobs to be done, gives five steps to build your own from goal to events, and shows a metric tree that explained why the north star grew only half as fast as active accounts.
What you will learn
- Connect goal → metrics → behaviors → events
- One north star with three to five inputs
- Express the north star as a formula of inputs
- Every metric needs events, an owner and a cadence
- Frameworks can be combined
What is a product analytics framework?
A product analytics framework is a structured way to decide what to measure in a product, how metrics relate to each other, and which analyses answer which questions. It connects the company's goal to a small set of metrics, those metrics to user behaviors, and those behaviors to tracked events. Without a framework, teams track whatever is easy and end up with many charts and few decisions.
A practical framework has four layers: goal → metrics → behaviors → events, plus a routine for reviewing them.
Common product analytics frameworks compared
| Framework | Structure | Best for | Watch out |
|---|---|---|---|
| North Star + inputs | One metric that captures delivered value, with 3–5 input metrics that drive it | Aligning teams on value | Choosing a north star that is really revenue |
| AARRR (pirate metrics) | Acquisition, activation, retention, referral, revenue | Growth teams, finding the weakest stage | Treats the journey as linear |
| HEART (Google) | Happiness, engagement, adoption, retention, task success, each with goals, signals, metrics | UX and feature-level measurement | Needs survey data for happiness |
| Metric tree | A top metric broken into multiplying or adding components | Explaining why a metric moved | Requires clean definitions at every level |
| Jobs to be done | Metrics tied to the progress customers want to make | Choosing what matters to customers | Harder to quantify directly |
Frameworks are not exclusive. Many teams use a North Star with a metric tree beneath it, AARRR for growth reviews and HEART for individual features.
| Layer | Example |
|---|---|
| Goal | Grow paying teams that use the product weekly |
| North star | Weekly active projects with 2+ collaborators |
| Inputs | Active accounts, projects per account, collaboration share |
| Events | project_created, member_invited, task_updated |
If a metric cannot be computed from events, it is not in the framework yet.
Build your own framework in five steps
1. Start from the goal
Write the business goal for the next year ("grow paying teams that use the product weekly") and the product's core value ("teams keep projects on track together").
2. Choose the north star and inputs
North star: a metric that rises when customers get value, for example "weekly active projects with at least two collaborators". Inputs: activation rate, collaborators per project, projects per account, retention of new accounts.
3. Break metrics into a tree
Express the north star as a formula of its inputs so every change can be traced. Weekly active projects = active accounts × projects per active account × share of projects with 2+ collaborators.
4. Map metrics to behaviors and events
For each input, name the behavior and the events and properties that measure it. Activation might need workspace_created, project_created and member_invited with account_id.
5. Assign analyses and owners
Each metric gets a standard analysis (funnel, cohort, distribution), an owner and a review cadence.
Worked example: a metric tree
A collaboration tool (sample data), two consecutive months:
| Node | Month 1 | Month 2 | Change |
|---|---|---|---|
| Weekly active projects (north star) | 18,000 | 18,810 | +4.5% |
| Active accounts | 6,000 | 6,600 | +10.0% |
| Projects per active account | 5.0 | 4.75 | −5.0% |
| Share of projects with 2+ collaborators | 60% | 60% | 0 |
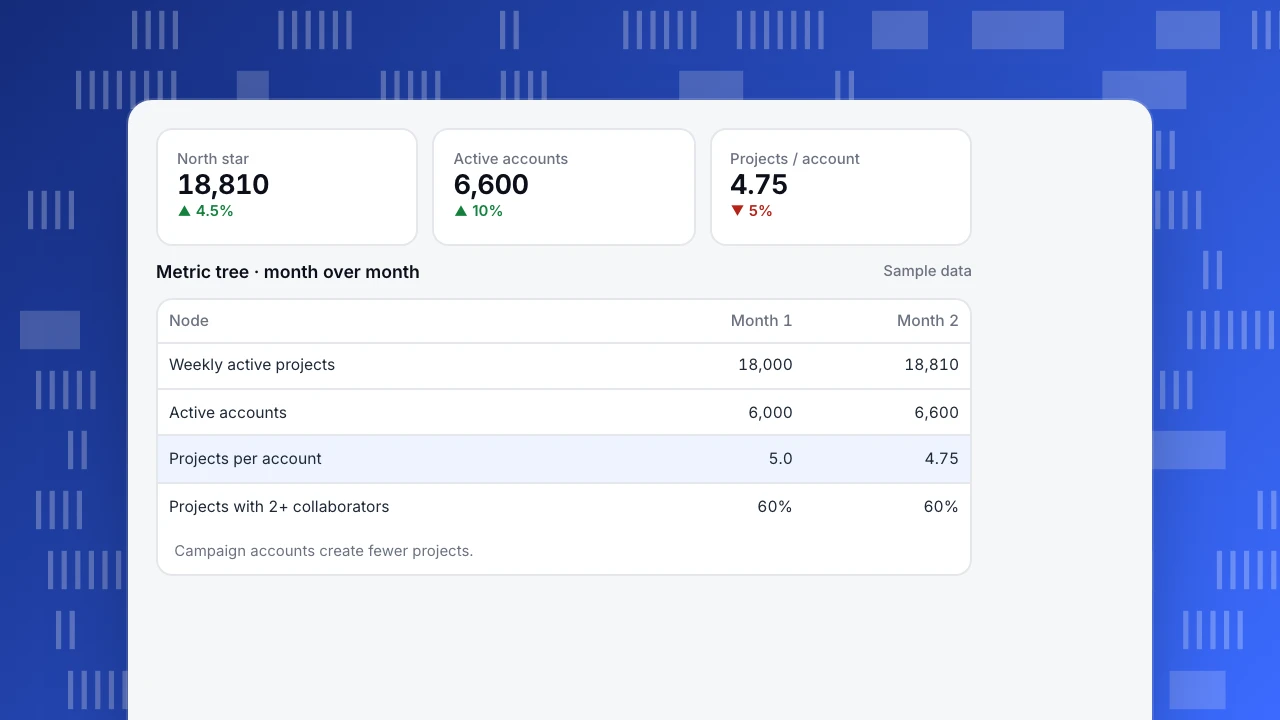
The north star grew 4.5%, but the tree shows why: active accounts grew 10% while projects per account fell 5%. Segmenting showed new accounts from a recent campaign create fewer projects. The next action was onboarding for campaign accounts (encouraging a second project), not acquisition.
Check: 6,000 × 5.0 × 0.60 = 18,000; 6,600 × 4.75 × 0.60 = 18,810.
North star
18,810
▲ 4.5%
Active accounts
6,600
▲ 10%
Projects / account
4.75
▼ 5%
Metric tree · month over month
Sample data| Node | Month 1 | Month 2 |
|---|---|---|
| Weekly active projects | 18,000 | 18,810 |
| Active accounts | 6,000 | 6,600 |
| Projects per account | 5.0 | 4.75 |
| Projects with 2+ collaborators | 60% | 60% |
Campaign accounts create fewer projects.
Common mistakes
- Too many metrics. A framework with 40 KPIs is a list, not a framework.
- Revenue as the north star. Revenue lags value; pick a usage metric that predicts it.
- Metrics without events. If you cannot compute it from tracked data, it is not in the framework yet.
- No owners. Unowned metrics are not acted on.
- Never revisiting. Products change; review the framework every six to twelve months.
Putting the framework into TapCub
- Events: a tracking plan with names, properties and owners; autocapture and an event inbox for discovery.
- Metrics: create custom metrics for your north star and inputs; saved insights for funnels, cohorts and distributions.
- Accounts: groups for account-level metrics in B2B products.
- AARRR pack: an AARRR view that groups stages; see AARRR.
- Explaining changes: the AI assistant attributes metric changes to segments.
Related: metric tree, north star metric, UX metrics and HEART, leading vs lagging indicators.
FAQ
What is the best product analytics framework? There is no single best one. A North Star with a metric tree works for most products; add AARRR for growth and HEART for feature-level UX.
How many metrics should a framework have? One north star, three to five inputs, and supporting metrics per team, ideally fewer than fifteen in regular review.
What is the difference between a framework and a tracking plan? The framework decides what to measure and why; the tracking plan specifies the events and properties needed to measure it.
How often should the framework change? Review it every six to twelve months, or when strategy, pricing or the product's core value changes.
Sources
- Amplitude. The North Star Playbook.
- McClure, D. (2007). Startup metrics for pirates: AARRR.
- Rodden, K., Hutchinson, H. and Fu, X. (2010). Measuring the user experience on a large scale. Google Research.
Was this article helpful?
We use your answers to fix and expand this page.
Couldn’t send. Please try again in a minute.
Thanks for the feedback. We’ll use it to improve this page.You’ve already sent feedback on this page. Thanks.

Product Adoption Consultant
Explores customer onboarding, live conversations, and self-service, turning common usage questions into practical guidance and improvements.