Try it on your own data
Every report in this article is in the free plan. One snippet for web and apps, up to 10 sites.
Start freeWhether a conversion rate is good depends on what you count as a conversion, what you divide by and who your visitors are. This guide gives rough ranges by conversion type, explains the two denominators, and shows how splitting one store’s 2.0% average finds 256 extra orders a month.
What you will learn
- Benchmarks only catch numbers that are wildly off; compare with yourself
- Per-session and per-visitor rates differ; state which one you use
- Split by device, channel and visitor type, then size the gap in money
The short answer
For an online store, a visit-to-purchase rate somewhere around 1–4% is common, and many lead-generation sites convert a low single-digit percentage of visitors into leads. But a benchmark tells you very little about your rate, for three reasons:
- "Conversion" means different things. A newsletter sign-up converts far more often than a purchase of a $2,000 product.
- The denominator changes the number. Conversions per session and converters per visitor can differ by a factor of two on the same site.
- Your traffic mix decides the average. More mobile, more cold social traffic or more first-time visitors pull the average down without anything being wrong.
So the useful question is not "is 2% good?" but "where is our rate low compared with our own best segments, and what is that gap worth?"
Rough ranges by conversion type
The table gives orders of magnitude often seen in public benchmark reports. Use them only to spot a number that is wildly off, for example a 0.05% store rate (probably broken tracking) or a 30% lead rate (probably counting the wrong event).
| Conversion type | Rough range often reported | What moves it most |
|---|---|---|
| Store visit to purchase | About 1–4% of sessions | Device, price, returning share |
| Lead form on a B2B site | Low single digits of visitors | Offer, form length, traffic intent |
| Targeted landing page to lead | Often 5–15% of visitors | Match between ad and page |
| Email or newsletter sign-up | A few percent of visitors | Placement, incentive |
| Free trial to paid (no card) | Often 10–25% of trials | Activation in the first days |
Orders of magnitude only. Use them to spot broken tracking, not to set targets.
Two definitions that change the number
- Per session: conversions divided by sessions. Common for stores, because each visit is a chance to buy. A visitor who comes back three times and buys once is one conversion in three sessions.
- Per visitor: people who converted divided by people who visited. Common for goals like sign-ups, because each person signs up once.
TapCub shows both: the goals report divides distinct converters by distinct visitors, while the data report divides conversion count by sessions. Neither is wrong; just compare like with like, and never compare your per-visitor rate with someone's per-session benchmark. To compute either quickly, use the conversion rate calculator.
A worked example: the average hides the problem
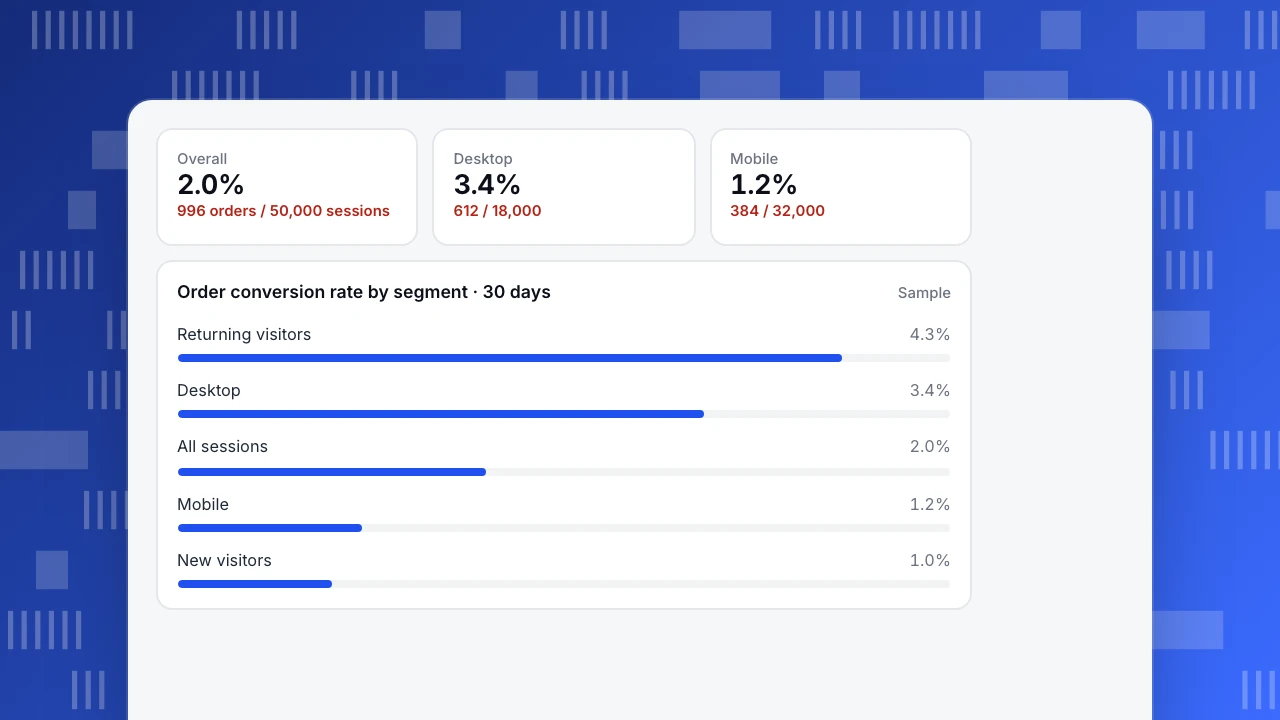
A store has 50,000 sessions and 996 orders in a month: a 2.0% conversion rate, squarely "average". Split it:
- Desktop: 612 orders from 18,000 sessions, 3.4%.
- Mobile: 384 orders from 32,000 sessions, 1.2%.
- Returning visitors: 4.3%. New visitors: 1.0%.
New and returning visitors are expected to differ. The device gap is the finding: mobile has nearly two thirds of the traffic and converts at about a third of the desktop rate. If mobile reached just 2.0%, still well below desktop, it would bring 640 orders instead of 384: 256 more orders a month with no extra traffic. That is the number that justifies work on the mobile product page and checkout, and it came from comparing the store with itself, not with a benchmark.
Overall
2.0%
996 orders / 50,000 sessions
Desktop
3.4%
612 / 18,000
Mobile
1.2%
384 / 32,000
Order conversion rate by segment · 30 days
SampleHow to judge your own rate
- Fix the definition. One conversion event, one denominator, written down.
- Split by device, channel and new vs returning. The lowest large segment is usually the opportunity.
- Compare with your own history. The same month last year, and the trend over 13 months, beat any industry average.
- Track earlier steps too. If the end conversion is rare, measure micro-conversions such as add-to-cart or pricing views; they move faster and show where people drop.
- Size the gap in money. "Mobile at 2.0% is 256 orders" gets a project approved; "we are below average" does not.
FAQ
What is the average website conversion rate?
There is no single meaningful average, because sites count different conversions. For stores, visit-to-purchase rates of roughly 1–4% are frequently reported; lead and sign-up rates vary much more with the offer.
Is a 10% conversion rate good?
For a purchase on a store, it would be exceptional and worth double-checking the tracking. For an email sign-up or a demo request from a targeted landing page, it can be normal.
Why is my conversion rate low?
Check tracking first (is the conversion firing on every path?), then traffic mix (a new low-intent channel lowers the average), then the experience on the weakest segment: speed and usability on mobile, a mismatch between ad and landing page, or a long form.
How is conversion rate calculated?
Conversions divided by sessions (or by visitors), times 100. State which denominator you used whenever you share the number. See the conversion rate definition.
Was this article helpful?
We use your answers to fix and expand this page.
Couldn’t send. Please try again in a minute.
Thanks for the feedback. We’ll use it to improve this page.You’ve already sent feedback on this page. Thanks.

Product Experience Specialist
Explores usability, user journeys, and feature adoption through practical examples of onboarding and everyday product use.