Try it on your own data
Every report in this article is in the free plan. One snippet for web and apps, up to 10 sites.
Start freeEcommerce KPI lists can run to 75 items. This guide builds the ones that matter week to week from one equation, revenue = sessions × conversion rate × average order value, shows how to read which factor moved, adds repeat purchase and refunds, and says where each number should come from.
What you will learn
- Revenue is sessions × conversion rate × average order value; compare months factor by factor
- Revenue per session combines conversion and order value into one comparable KPI
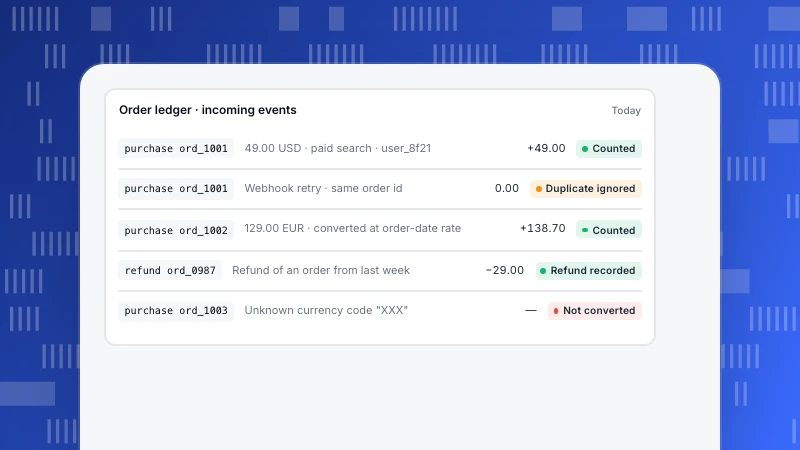
- Take orders and refunds from the backend, report refunds separately, and dedupe by order id
The revenue equation
Lists of ecommerce KPIs run from 10 to 75 items. Most of the ones that matter week to week are factors of one equation:
revenue = sessions × conversion rate × average order value
Sessions is how many visits the store got. Conversion rate is orders divided by sessions. Average order value (AOV) is revenue divided by orders. Multiply the three and you get revenue; change one and you can see exactly how much revenue it is worth.
A fourth number falls out for free: revenue per session (revenue ÷ sessions, also called revenue per visitor). It combines conversion and order value into one figure, which makes it a good single KPI for comparing channels or landing pages.
Read which factor moved
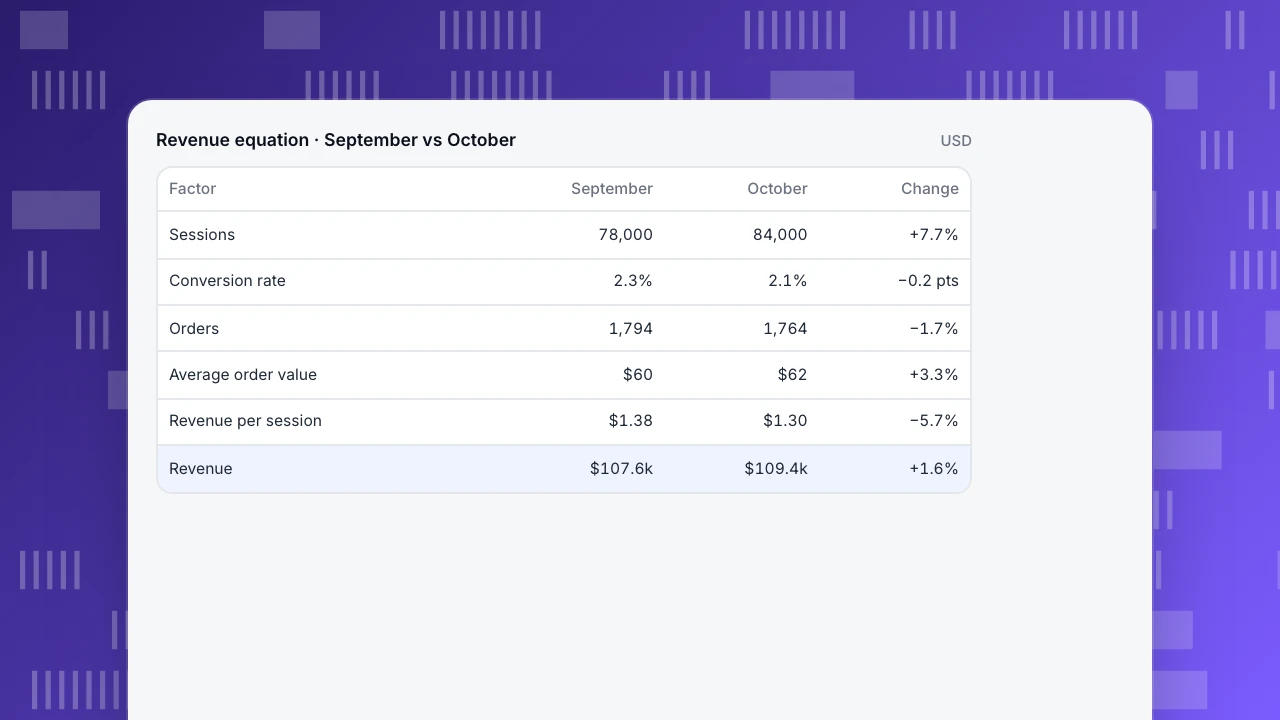
The example compares two months. Revenue went up 1.6%, which looks fine. The equation shows why it is not:
- Sessions rose 7.7%, mostly from a new paid campaign.
- Conversion rate fell from 2.3% to 2.1%. The new traffic converts worse.
- AOV rose from $60 to $62, from a free-shipping threshold.
- Revenue per session fell from $1.38 to $1.30.
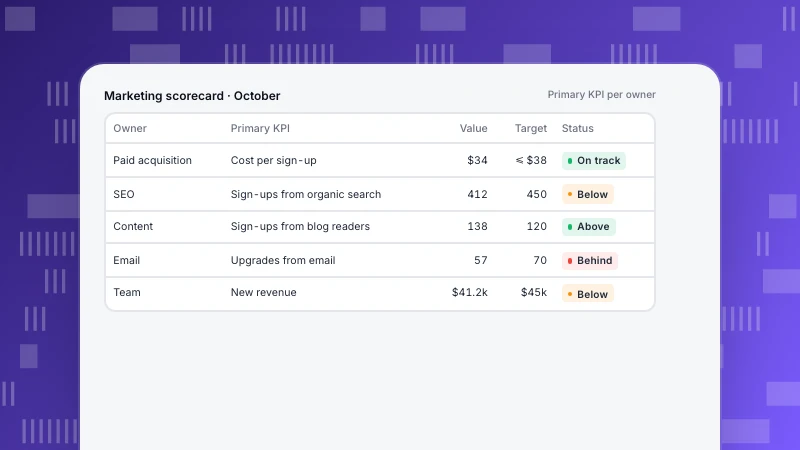
Without the breakdown, the team would read "revenue up" and spend more on the campaign. With it, the question becomes whether the campaign's visitors are worth what they cost. Break conversion rate down by channel next, as in marketing KPIs.
Revenue equation · September vs October
USD| Factor | September | October | Change |
|---|---|---|---|
| Sessions | 78,000 | 84,000 | +7.7% |
| Conversion rate | 2.3% | 2.1% | −0.2 pts |
| Orders | 1,794 | 1,764 | −1.7% |
| Average order value | $60 | $62 | +3.3% |
| Revenue per session | $1.38 | $1.30 | −5.7% |
| Revenue | $107.6k | $109.4k | +1.6% |
After the first order
The equation describes one month. Whether the store grows over years depends on what happens after the first order:
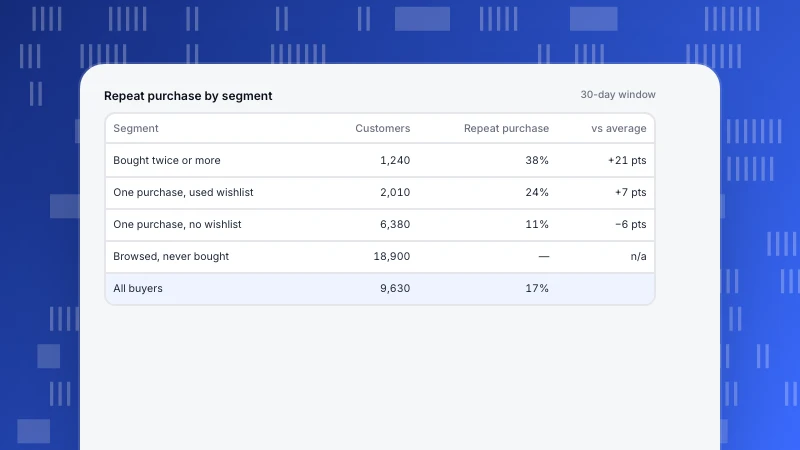
- Repeat purchase rate: customers with two or more orders ÷ customers who bought.
- Time between orders: the median days from first to second order.
- Customer lifetime value: cumulative revenue per customer, grouped by the month of their first order.
- Refund rate: refunded orders ÷ orders, and refunded amount ÷ revenue.
Split these by first channel or first product to see which customers come back. See customer segmentation analysis.
Ecommerce KPI table
The table lists the KPIs by layer with formula and source. Traffic and behaviour come from analytics. Orders, refunds and margin should come from the store or payment backend, sent as server events, so that the money in analytics matches the money in the bank.
Cart abandonment rate is useful but easy to misread. It counts sessions that added to cart and did not buy, and many of those buyers come back later in another session. Read it next to the purchase funnel, not alone.
| Layer | KPI | Formula | Source |
|---|---|---|---|
| Traffic | Sessions by channel | Count of visits | Analytics |
| Conversion | Conversion rate | Orders ÷ sessions | Analytics + orders |
| Conversion | Cart abandonment | Sessions with add-to-cart and no purchase ÷ sessions with add-to-cart | Analytics |
| Value | Average order value | Revenue ÷ orders | Orders |
| Value | Revenue per session | Revenue ÷ sessions | Analytics + orders |
| Loyalty | Repeat purchase rate | Customers with 2+ orders ÷ customers | Orders |
| Loyalty | Lifetime value | Cumulative revenue per customer by first-order month | Orders |
| Quality | Refund rate | Refunded orders ÷ orders | Refunds |
Orders and refunds should come from the store backend as server events.
Consistency rules
Ecommerce numbers disagree between tools mostly because of a few choices. Decide them once:
- Gross or net of refunds. Report revenue and refunds as separate lines rather than silently netting.
- Currency. Convert each order on its order date into one base currency.
- Tax and shipping. Include or exclude them consistently in revenue and AOV.
- Denominator for conversion. Sessions or visitors; say which. Session-based rates look lower than visitor-based ones.
- Dedupe. Every order has an order id; retries and duplicate confirmation pages do not create new orders.
GMV and revenue are also different: GMV is the total paid value of orders, before refunds and fees.
Ecommerce KPIs in TapCub
TapCub reads money from the purchase event's properties (amount, currency and order id) rather than guessing from pageviews. Defaults are purchase, refund, revenue, currency and order_id; the order id is the dedupe key. Amounts are converted into the base currency on the order date, and refunds in the same period are reported separately, not subtracted. The commerce page shows revenue, orders, buyers, average order, paying rate, repeat rate, refunds, cart abandon rate and lifetime value by first-purchase month (commerce & revenue).
The e-commerce industry pack defines the event line (view_item, add_to_cart, begin_checkout, purchase, optional refund) and installs metrics, a purchase funnel and dashboards in one step (industry packs). Send purchases and refunds from the server; see revenue tracking and the e-commerce page.
FAQ
What are the most important ecommerce KPIs?
Sessions, conversion rate, average order value and revenue per session for each month; repeat purchase rate, refund rate and lifetime value over longer periods.
How do you calculate ecommerce conversion rate?
Orders divided by sessions (or by visitors, if you say so). Use the same denominator every month.
What is revenue per session?
Revenue divided by sessions. It equals conversion rate times average order value, so it moves when either one does.
Should refunds be subtracted from revenue?
Report them as a separate line. Subtracting silently makes months hard to compare when refunds arrive late.
Why does cart abandonment look so high?
It counts every session with an add-to-cart and no purchase, including people who come back and buy later. Read it with the purchase funnel.
See also: Ecommerce analytics, Ecommerce funnel.
Was this article helpful?
We use your answers to fix and expand this page.
Couldn’t send. Please try again in a minute.
Thanks for the feedback. We’ll use it to improve this page.You’ve already sent feedback on this page. Thanks.

Data Engineer
Writes about event design, data quality, and collection workflows, with verifiable implementation methods for reliable analytics.