Try it on your own data
Every report in this article is in the free plan. One snippet for web and apps, up to 10 sites.
Start freeEcommerce analytics connects where shoppers come from, what they do and what they buy, so you can see which channels and products are actually profitable. This guide lists the key metrics with formulas, five reports every store should review, how to set up reliable tracking, and an example where a high-traffic channel brought low revenue, high refunds and few repeat buyers.
What you will learn
- Join traffic, behavior and transaction data
- Send purchases and refunds server-side
- Reconcile analytics with your store weekly
- Judge channels on revenue, refunds and repeat rate
- Review funnels weekly, customers monthly
What is ecommerce analytics?
Ecommerce analytics is the collection and analysis of data about how an online store attracts shoppers, how they browse and buy, and how much value they bring over time. It joins three kinds of data: traffic (where shoppers come from), behavior (what they view, add to cart and abandon) and transactions (orders, revenue, refunds, repeat purchases). The goal is to answer commercial questions: which channels bring profitable customers, which products and pages convert, where shoppers drop out, and who comes back.
Store platforms show orders and revenue; analytics adds the journey that led to them and the visitors who did not buy.
The ecommerce metrics that matter
| Area | Metric | Formula |
|---|---|---|
| Acquisition | Sessions and revenue by channel | Grouped by source / medium / campaign |
| Cost per acquisition (paid) | Ad spend ÷ new customers | |
| Conversion | Conversion rate | Orders ÷ sessions |
| Add-to-cart rate | Sessions with add to cart ÷ sessions with a product view | |
| Cart abandonment rate | 1 − orders ÷ carts created | |
| Value | Average order value (AOV) | Revenue ÷ orders |
| Revenue per visitor | Revenue ÷ visitors | |
| Retention | Repeat purchase rate | Customers with 2+ orders ÷ customers |
| Customer lifetime value (LTV) | Average order value × orders per customer × gross margin (simple form) | |
| Quality | Refund rate | Refunded orders ÷ orders |
| Product | Product conversion rate | Purchases of a product ÷ views of that product |
| Report | Question |
|---|---|
| Channels | Which traffic sells? |
| Funnel | Where do shoppers drop out? |
| Products | What attracts but does not sell? |
| Customers | Is growth from new or returning buyers? |
| Landing pages | Which pages start profitable journeys? |
Five reports cover most commercial questions.
Five reports every store should look at
- Channel report. Sessions, conversion rate, revenue and AOV by channel. Separates traffic that sells from traffic that only visits.
- Funnel report. Product view → cart → checkout → purchase, split by device. Shows where shoppers drop out.
- Product report. Views, add-to-cart rate, purchases and refunds per product. Finds products that attract interest but do not sell, or sell and come back.
- Customer report. New vs returning revenue, repeat purchase rate and time between orders. Tells you whether growth comes from acquisition or loyalty.
- Landing page report. Entrances, bounce and revenue per landing page. Shows which pages start profitable journeys.
How to set up ecommerce analytics
1. Track the right events
Product viewed, added to cart, removed from cart, checkout started, checkout step, purchase (with order ID, revenue, currency, items) and refund. Use the same product and order IDs as your store.
2. Send purchases from the server when possible
Ad blockers and closed tabs make browser-only purchase tracking incomplete. Sending purchases and refunds from your backend makes revenue reliable.
3. Reconcile with your store
Compare a week of orders and revenue with the store platform. A gap above a few percent needs an explanation.
4. Attribute revenue to channels
Use campaign tags (UTM) consistently and compare attribution models (first touch, last touch, linear) to see which channels start and close sales.
5. Review weekly, decide monthly
Weekly: funnel and channel changes. Monthly: product, customer and LTV trends.
Worked example: channel quality
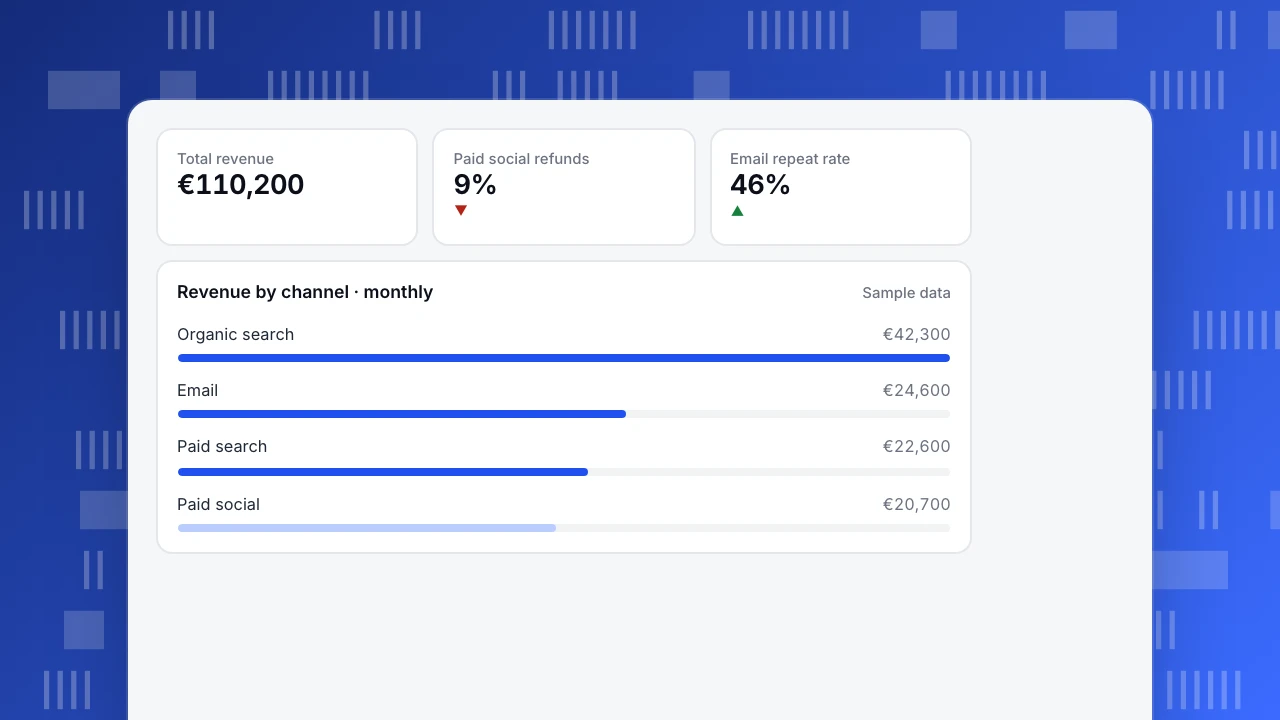
An online cosmetics store (sample data), one month:
| Channel | Sessions | Conversion | AOV | Revenue | Refund rate | Repeat rate (90 days) |
|---|---|---|---|---|---|---|
| Organic search | 42,000 | 2.1% | €48 | €42,300 | 3% | 31% |
| Paid social | 38,000 | 1.4% | €39 | €20,700 | 9% | 14% |
| 9,000 | 4.8% | €57 | €24,600 | 2% | 46% | |
| Paid search | 15,000 | 2.9% | €52 | €22,600 | 4% | 27% |
Paid social brings almost as many sessions as organic search but less than half the revenue, triple the refund rate and half the repeat rate. Cutting low-performing social campaigns by 30% and moving the budget to paid search and email capture raised monthly revenue by about 6% with the same spend.
Total revenue
€110,200
Paid social refunds
9%
▼
Email repeat rate
46%
▲
Revenue by channel · monthly
Sample dataCommon mistakes
- Looking at revenue without margin or refunds. High-revenue channels can be unprofitable.
- Browser-only purchase tracking. Expect missing orders; send purchases server-side.
- Last-click only. Channels that introduce customers look worse than they are.
- Ignoring repeat customers. Profit often comes from the second and third order.
- Mixed currencies and time zones. Normalize before comparing.
Ecommerce analytics in TapCub
- Commerce & revenue: revenue, orders, buyers, average order, paying rate, revenue per user and per buyer, first-time buyers, repeat rate, refunds, and cart abandon rate with the value left behind, from an order ledger.
- Tracking: track ecommerce purchases in the browser, or send server-side events from your backend. Shopify has an install guide.
- Funnels and attribution: funnels by device and channel; attribution with first, last, linear, position and time-decay models.
- Customers: RFM segments, cohorts and lifecycle.
Related: ecommerce KPIs, ecommerce funnel, AOV, repeat rate.
FAQ
What is the difference between ecommerce analytics and web analytics? Web analytics measures visits and behavior on any site. Ecommerce analytics adds products, carts, orders, revenue, refunds and customer value.
Which ecommerce metrics should I track first? Conversion rate, average order value, revenue by channel and cart abandonment, followed by repeat purchase rate and refunds.
Why does my analytics revenue not match my store platform? Ad blockers, closed tabs before the confirmation page, refunds, currencies and time zones. Server-side purchase events reduce the gap.
How often should I review ecommerce analytics? Weekly for funnels and channels, monthly for products, customers and lifetime value.
Sources
- Google. Measure ecommerce (GA4 developer guide).
- Baymard Institute. Cart abandonment rate statistics.
Was this article helpful?
We use your answers to fix and expand this page.
Couldn’t send. Please try again in a minute.
Thanks for the feedback. We’ll use it to improve this page.You’ve already sent feedback on this page. Thanks.

Data Engineer
Writes about event design, data quality, and collection workflows, with verifiable implementation methods for reliable analytics.