Try it on your own data
Every report in this article is in the free plan. One snippet for web and apps, up to 10 sites.
Start freeThe leaky bucket is a picture of a common growth problem: you keep pouring new customers in at the top, but existing customers leak out through holes in the bottom. However hard you pour, the level stops rising. This guide shows the simple math behind it, a sample comparing two ways to grow, and how to find and fix the leaks.
What you will learn
- With steady acquisition and churn, customers level off at new customers per month divided by monthly churn
- Halving churn doubles the ceiling; doubling acquisition only raises it as much, at higher cost
- Find leaks by stage: activation, early churn and late churn need different fixes
What the leaky bucket means
In marketing, the leaky bucket describes a business that spends on acquisition while losing customers at the same time. New customers are water poured in at the top. Churn is the holes in the bottom. If the holes are big, more water just leaks out faster.
The term is also used in computer networking for a rate-limiting algorithm. That is unrelated; this article is about the growth idea.
The math behind the ceiling
If you add the same number of new customers each month and lose the same share each month, the total stops growing at a ceiling:
Ceiling = new customers per month ÷ monthly churn rate
With 500 new customers a month and 5% monthly churn, the ceiling is 10,000. The table shows how the ceiling moves when you change each lever. Halving churn has the same effect on the ceiling as doubling acquisition.
The closer you get to the ceiling, the slower you grow, which is why growth feels like it is stalling even though acquisition is steady.
| Monthly new customers | Monthly churn | Where customers level off |
|---|---|---|
| 500 | 5% | 10,000 |
| 1,000 | 5% | 20,000 |
| 500 | 2.5% | 20,000 |
| 1,000 | 2.5% | 40,000 |
Ceiling = new per month ÷ churn rate. Reaching it takes time; the closer you get, the slower the rise.
A worked example
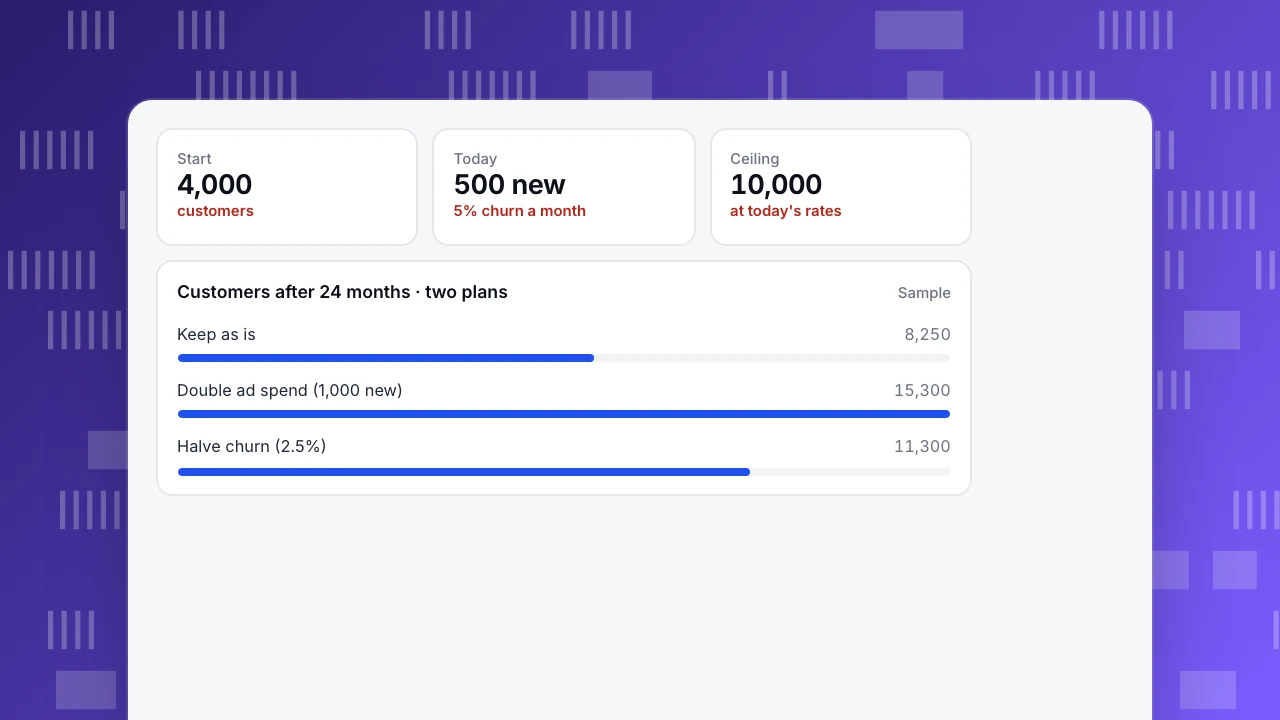
A subscription business has 4,000 customers, adds 500 a month and loses 5% a month. Its ceiling is 10,000. The team compares two plans over 24 months:
- Double ad spend to get 1,000 new customers a month: about 15,300 customers after 24 months, at twice the acquisition cost.
- Halve churn to 2.5% with better onboarding: about 11,300 customers after 24 months, and the ceiling rises to 20,000 too.
Doubling acquisition gets further within 24 months. But both plans head for the same 20,000 ceiling, the churn plan costs far less each month, and doing both raises the ceiling to 40,000. Fixing the leak first makes every later dollar of acquisition worth more.
Start
4,000
customers
Today
500 new
5% churn a month
Ceiling
10,000
at today's rates
Customers after 24 months · two plans
SampleWhere buckets leak
Leaks have different causes at different ages:
- Never activated. People sign up and never reach the first value. Fix onboarding. See onboarding metrics.
- Early churn. People try the product and leave in the first one or two months. Check whether the product matches what the marketing promised.
- Late churn. Established customers leave. Check price, support, competition and changing needs.
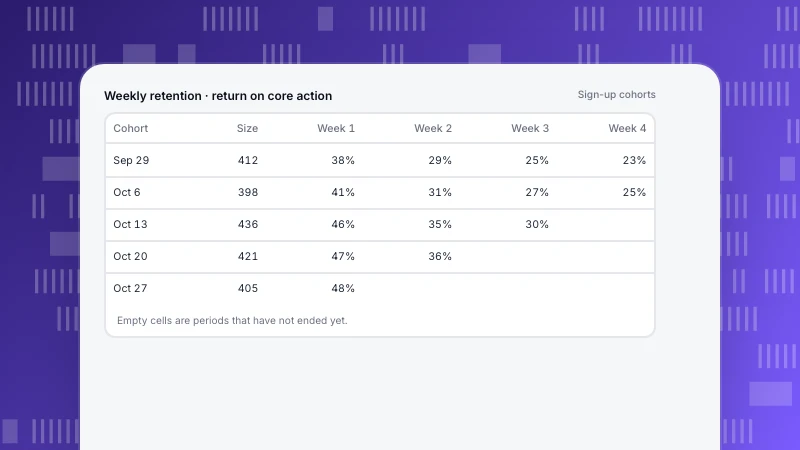
Measure each with retention cohorts: a steep drop in the first periods points to 1 or 2; a slow slide later points to 3. See retention metrics.
Finding leaks in your data
- Lifecycle view. In TapCub each week or month splits active people into new, returning, resurrecting and dormant. A dormant bar that grows as fast as the new bar is a leaking bucket.
- Cohorts. Compare recent cohorts with older ones at the same age.
- Churn reasons. Pair the data with exit surveys or cancellation reasons.
FAQ
What is the leaky bucket theory in marketing?
The idea that growth stalls when you focus on acquiring new customers while losing existing ones, because churn caps how large the customer base can get.
How do I fix a leaky bucket?
Find which stage loses most people (activation, early churn or late churn), fix that stage, then measure cohorts again.
Should I stop spending on acquisition?
Not necessarily. But if churn is high, a share of the budget usually does more good spent on retention first.
Was this article helpful?
We use your answers to fix and expand this page.
Couldn’t send. Please try again in a minute.
Thanks for the feedback. We’ll use it to improve this page.You’ve already sent feedback on this page. Thanks.

Data Engineer
Writes about event design, data quality, and collection workflows, with verifiable implementation methods for reliable analytics.