Try it on your own data
Every report in this article is in the free plan. One snippet for web and apps, up to 10 sites.
Start freeA store’s conversion rate is one number, but it hides where buyers drop off. This guide explains session and visitor conversion rates, why benchmarks disagree, and walks through a sample store split by device and funnel step to find what to fix first.
What you will learn
- Say whether you divide by sessions or by visitors; benchmarks mix the two
- Split by device and funnel step: the average hides the step where most buyers are lost
- Fix the biggest relative drop first, and watch order value and margin as the rate moves
What is ecommerce conversion rate?
Ecommerce conversion rate is the share of visits, or visitors, that end in a purchase. A store with 40,000 sessions and 1,000 orders in a month has a session conversion rate of 2.5%.
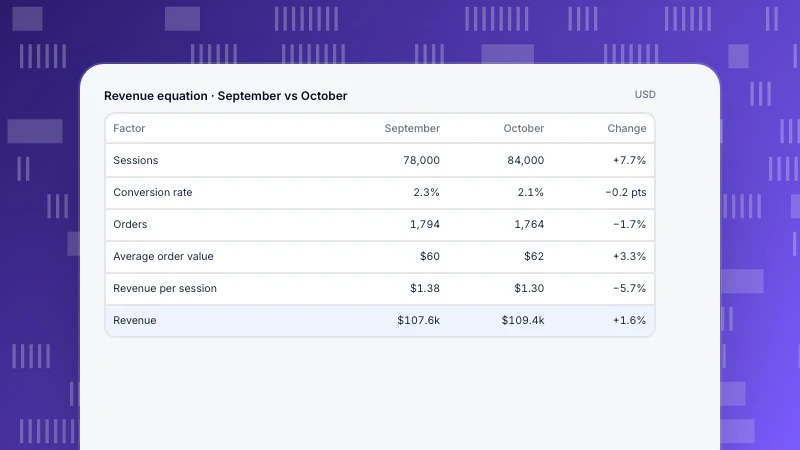
It is the single number that ties traffic to revenue: revenue = sessions × conversion rate × average order value. Raise any of the three and revenue rises.
How to calculate it
Session conversion rate = orders ÷ sessions
Visitor conversion rate = buyers ÷ unique visitors
The two answer different questions. Session rate shows how well each visit converts; visitor rate shows how many people eventually buy. Because many people visit several times before buying, visitor rate is usually higher. Always say which one you report.
Why benchmarks disagree
Published averages for ecommerce often fall somewhere between about 1% and 4%, and they rarely agree, because:
- Some divide by sessions, others by visitors.
- Industries differ: groceries and repeat consumables convert far better than furniture or travel.
- Price matters: a $15 item and a $1,500 item are different decisions.
- Traffic mix matters: a store living on email and brand search converts better than one buying cold social traffic.
Your own trend, by device and channel, is a better benchmark than someone else's average. See what is a good conversion rate.
A sample store, split two ways
One month, 40,000 sessions and 1,000 orders, a 2.5% session rate (sample numbers).
By device:
| Device | Sessions | Orders | Conversion rate |
|---|---|---|---|
| Desktop | 16,000 | 512 | 3.2% |
| Mobile | 22,000 | 440 | 2.0% |
| Tablet | 2,000 | 48 | 2.4% |
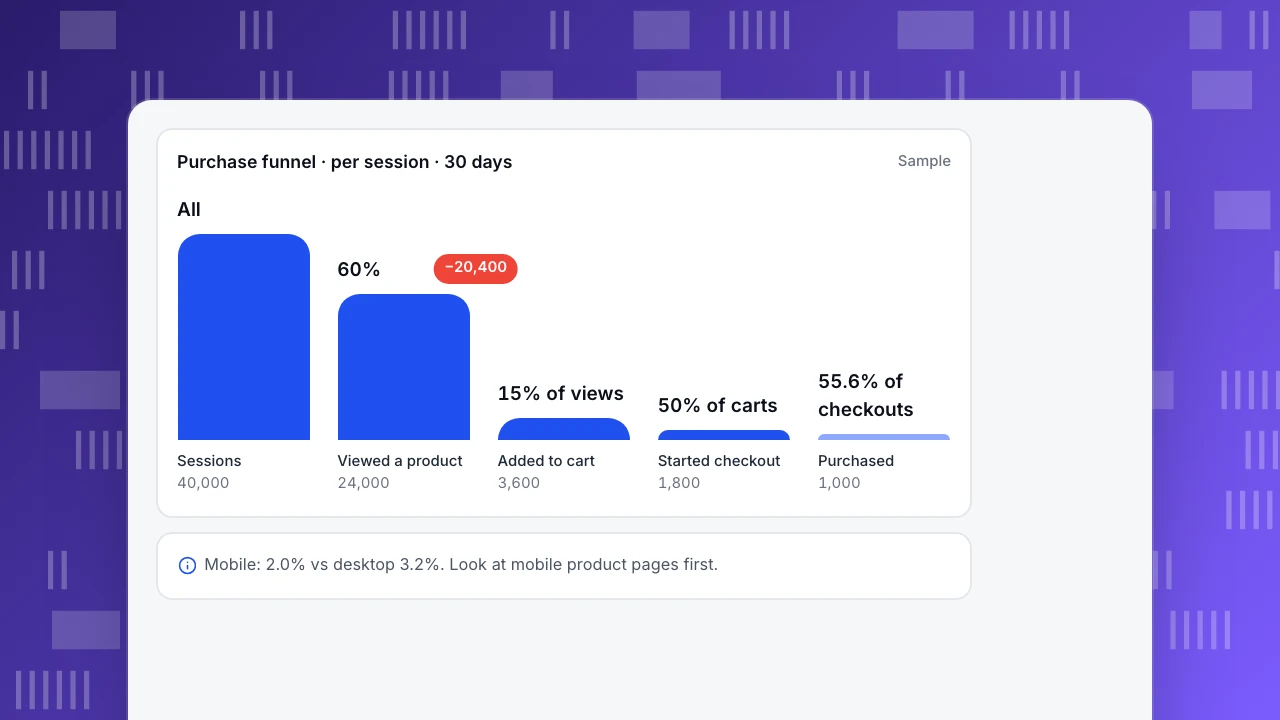
By funnel step: 24,000 sessions viewed a product (60%), 3,600 added to cart (15% of product views), 1,800 started checkout (50% of carts), and 1,000 bought (55.6% of checkouts).
Mobile brings most of the traffic and converts at well under desktop's rate. Within the funnel, the biggest relative loss is between product view and cart. That is where to look first: product pages on mobile.
Purchase funnel · per session · 30 days
SampleSessions
40,000
Viewed a product
24,000
Added to cart
3,600
Started checkout
1,800
Purchased
1,000
Levers for each step
The table below matches each funnel step to the usual causes and fixes.
| Step | Common causes of drop-off | Typical fixes |
|---|---|---|
| Landing → product view | Wrong audience, slow page, unclear navigation | Better targeting, faster pages, clearer categories and search |
| Product view → cart | Missing information, price shock, weak photos, no reviews | Specs, shipping costs shown early, photos, reviews, sizing help |
| Cart → checkout | Surprise costs, forced account creation | Show totals early, guest checkout |
| Checkout → purchase | Long forms, few payment options, errors | Fewer fields, more payment methods, error monitoring |
Fix the step with the largest relative loss first, then re-measure.
Common mistakes
- Comparing session rates with visitor rates.
- Counting bots and internal traffic in the denominator; it pushes the rate down.
- Chasing the rate alone. A discount can raise conversion and lower profit; watch average order value and margin too.
- Judging small segments. A rate on 200 sessions moves a lot by chance.
- Ignoring returns and cancellations, which can turn a high conversion campaign into a poor one.
Where to see it in TapCub
- All-platform analytics › Business › Commerce & revenue shows orders, buyers, revenue, average order and paying rate from your purchase events, plus a per-session purchase funnel (view item, add to cart, checkout, purchase) and cart abandonment. See cart abandonment rate.
- Web analytics › Goals gives a purchase goal's conversion rate per unique visitor, with breakdowns by source, entry page, country and device.
- For the step-by-step path to purchase, see purchase path.
Send purchases from your server where you can, so blockers and closed tabs do not lose orders.
See also: Ecommerce CRO, Mobile CRO.
See also: Live chat for ecommerce: where it helps a store sell, and how to measure it.
Was this article helpful?
We use your answers to fix and expand this page.
Couldn’t send. Please try again in a minute.
Thanks for the feedback. We’ll use it to improve this page.You’ve already sent feedback on this page. Thanks.

Data Engineer
Writes about event design, data quality, and collection workflows, with verifiable implementation methods for reliable analytics.