Try it on your own data
Every report in this article is in the free plan. One snippet for web and apps, up to 10 sites.
Start freeDual-axis charts are common in dashboards because they fit two measures into one space. But the two scales are independent, so the chart can show crossings and trends that the data does not support. This guide shows the problem with real numbers, and four clearer ways to show the same data.
What you will learn
- The two y-axis ranges are arbitrary, so crossings and gaps between lines mean nothing
- Two aligned panels, an index to 100, or the outcome count usually say it more honestly
- If you use a dual axis, start at zero, label units and colours, and never read the crossing point
What a dual-axis chart is
A dual-axis chart shows two measures on the same time axis, each with its own y-axis: one on the left, one on the right. A common example is sessions as bars (left axis) and conversion rate as a line (right axis).
It saves space and puts two things side by side. The problem is that the two y-axes are independent, so their ranges are a choice, and that choice decides what the chart appears to say.
How axis ranges change the story
Take six weeks of data (sample numbers): sessions rise from 10,000 to 16,000, conversion rate falls from 3.0% to 2.4%.
- Left axis 0–20,000 and right axis 0–4%: the bars rise gently and the line drifts down. Readers see "traffic up a bit, conversion down a bit".
- Left axis 9,000–16,000 and right axis 2.3–3.1%: the bars shoot up and the line plunges; the two lines cross in week 3. Readers see "a crisis that started in week 3".
Same data, opposite impressions. The crossing point has no meaning at all; it is an artefact of the two ranges. Readers also tend to read the gap between the lines as meaningful, and to confuse which line belongs to which axis.
The same data, four ways
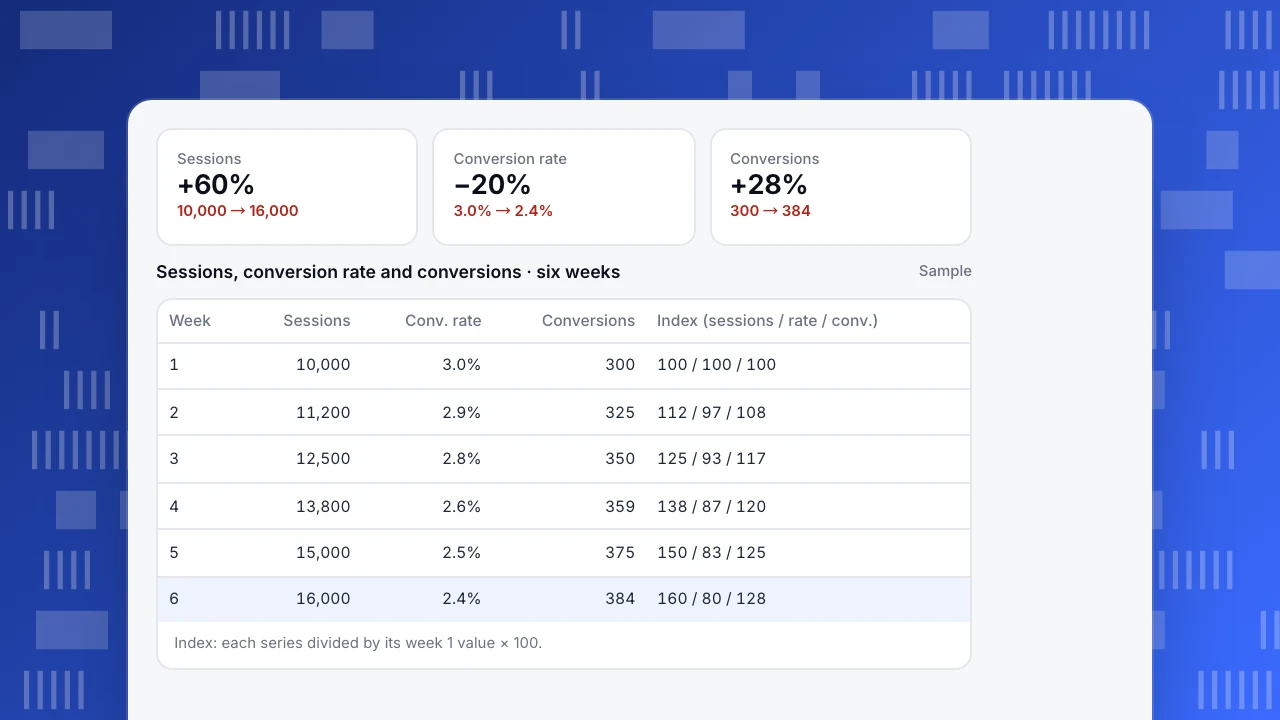
The six weeks behind both versions above are listed in the chart below. Week 6 vs week 1: sessions +60%, conversion rate −20%, conversions +28%.
- Dual axis: shows both, but the story depends on the ranges chosen.
- Two panels, one above the other: sessions on top, conversion rate below, sharing the time axis. Each has an honest scale; the alignment of weeks is kept.
- Index to 100: divide each series by its week 1 value. Sessions end at 160, conversion rate at 80, conversions at 128. One axis, one unit, direct comparison of change.
- The count that matters: if the question is "did the extra traffic pay off?", chart conversions (300 → 384). It answers the question directly: yes, but less than traffic suggests, because the new visitors convert worse.
Sessions
+60%
10,000 → 16,000
Conversion rate
−20%
3.0% → 2.4%
Conversions
+28%
300 → 384
Sessions, conversion rate and conversions · six weeks
Sample| Week | Sessions | Conv. rate | Conversions | Index (sessions / rate / conv.) |
|---|---|---|---|---|
| 1 | 10,000 | 3.0% | 300 | 100 / 100 / 100 |
| 2 | 11,200 | 2.9% | 325 | 112 / 97 / 108 |
| 3 | 12,500 | 2.8% | 350 | 125 / 93 / 117 |
| 4 | 13,800 | 2.6% | 359 | 138 / 87 / 120 |
| 5 | 15,000 | 2.5% | 375 | 150 / 83 / 125 |
| 6 | 16,000 | 2.4% | 384 | 160 / 80 / 128 |
Index: each series divided by its week 1 value × 100.
Which to use
The table below compares the options.
| Option | Best for | Watch out for |
|---|---|---|
| Dual axis | Two closely related measures for an expert audience | Arbitrary ranges create false crossings |
| Two aligned panels | Two measures with different units over time | Needs vertical space; keep the time axes identical |
| Index to 100 | Comparing the size of change across measures | Hides absolute levels; state the base period |
| Ratio or derived metric | When the relationship is the point (e.g. conversions per session) | Explain how it is calculated |
| Scatter plot | Checking whether two measures move together | Loses the time order unless labelled |
When in doubt, chart the outcome the reader cares about.
If you must use a dual axis
- Use it only when the two measures are closely related and the audience knows both well.
- Start both axes at zero, or explain why not.
- Use different mark types (bars and a line) and colour each axis label to match its series.
- Label the axes with units, and put the measure names in the legend and on the axes.
- Never draw conclusions from where the lines cross or how far apart they are.
Doing it in TapCub
In All-platform analytics › Overview › My dashboards, put each measure on its own card from a saved analysis, with the same date range and granularity, and place them one above the other so the weeks line up: the two-panel approach. For a direct comparison of change, save a custom metric that divides one measure by another in All-platform analytics › Behavior › Metrics & SQL, or chart the outcome count itself. For telling the story around the chart, see data storytelling; for dashboard layout, see KPI dashboard.
Was this article helpful?
We use your answers to fix and expand this page.
Couldn’t send. Please try again in a minute.
Thanks for the feedback. We’ll use it to improve this page.You’ve already sent feedback on this page. Thanks.

Product Experience Specialist
Writes about product experience, practical workflows, and growth, turning complex processes into clear steps for everyday decisions.