Try it on your own data
Every report in this article is in the free plan. One snippet for web and apps, up to 10 sites.
Start freeProduct optimization is the continuing work of improving an existing product, run as a loop: pick one metric and a guardrail, find the funnel step where fixing it is worth the most, write a hypothesis with evidence, ship or test a small change and read the result. Rank steps by what each fix would add, not by gut feel.
What you will learn
- Rank funnel steps by the ceiling of each fix, not only by the lowest rate: in the sample, lifting the first step to 80% adds 67 day-7 users
- A smaller effect needs far more people: halving the lift from +10 to +5 points takes the test from 343 to 1,434 sign-ups per variant
- Plan for misses: if a third of ideas win, expect about three experiments per win
What is product optimization, and what is it not?
Product optimization is the continuing work of improving a product that already exists, so that more of the people who use it get value from it and come back. It is different from discovery, which decides what to build, and different from optimizing a marketing page: the goal is not one more click on a banner but more people reaching the point where the product works for them.
The working definition used here is a loop, not a one-off project:
Pick a metric → find the biggest gap → write a hypothesis → test or ship a small change → read the result → keep, revise or drop → pick the next gap.
This guide is about the first half of that loop, which is where most teams go wrong: choosing the metric and the gap with numbers instead of opinions. The testing step itself is covered in the A/B testing guide. The claim to keep in mind is that the loop is only as fast as your slowest step, and the slowest step is usually knowing which gap is worth fixing. Most ideas do not work even when well made: a Bing team reported that less than a third of the ideas it tested moved the metrics they were designed to improve, so you need a way to choose well and to expect misses.
What are the six steps of the loop?
| Step | Question | Output |
|---|---|---|
| 1. Metric | What does success look like for this product? | One metric with a definition and a window |
| 2. Gap | Where is the biggest shortfall, and for whom? | A funnel or adoption chart with one step highlighted |
| 3. Hypothesis | Why does the gap exist, and what change would close it? | One sentence with evidence and a target |
| 4. Change | What is the smallest version that tests the hypothesis? | A change small enough to ship or test in weeks |
| 5. Read | Did the metric move, and did anything else break? | Result with a guardrail check |
| 6. Decide | Keep, revise or drop? | A written decision, and the next gap |
Two habits make the loop work. Write each step down, because teams that skip the written hypothesis cannot tell later whether they were right. And change one thing at a time on one step of the funnel, so that a movement in the metric has one possible explanation.
How do you pick the metric?
Start from what the product is for, not from the numbers your tool shows by default. A useful method comes from Google's HEART framework, described by Kerry Rodden, Hilary Hutchinson and Xin Fu in a 2010 CHI paper. It groups user-centred metrics into five categories: Happiness, Engagement, Adoption, Retention and Task success, and it recommends mapping each product goal to signals and then to metrics instead of picking metrics first.
For a team without survey data, three of the five are measurable from behavior alone:
- Adoption: the share of new or active users who do a key thing, such as creating a project or using a feature.
- Retention: the share who come back after the first visit, by day, week or month.
- Task success: the share who finish an ordered job, such as setup or checkout, and how long it takes.
Pick one primary metric for the cycle and name one guardrail, a number that must not get worse while you chase the first. A product trying to raise activation might guard support tickets per new user. The guardrail metrics and North Star metric pages cover how to choose them.
How do you find the biggest gap?
Draw the journey you want people to take as an ordered funnel, with real events at each step, and look at where the rate between steps is weakest. Then rank the steps by what fixing each one would be worth.
Sample data: 1,000 new sign-ups in a month go through four steps of onboarding.
| Step | People | Rate from previous step | Lost at this step |
|---|---|---|---|
| Signed up | 1,000 | — | — |
| Created a project | 620 | 62.0% | 380 |
| Installed the code | 410 | 66.1% | 210 |
| Sent a first event | 330 | 80.5% | 80 |
| Came back on day 7 | 231 | 70.0% | 99 |
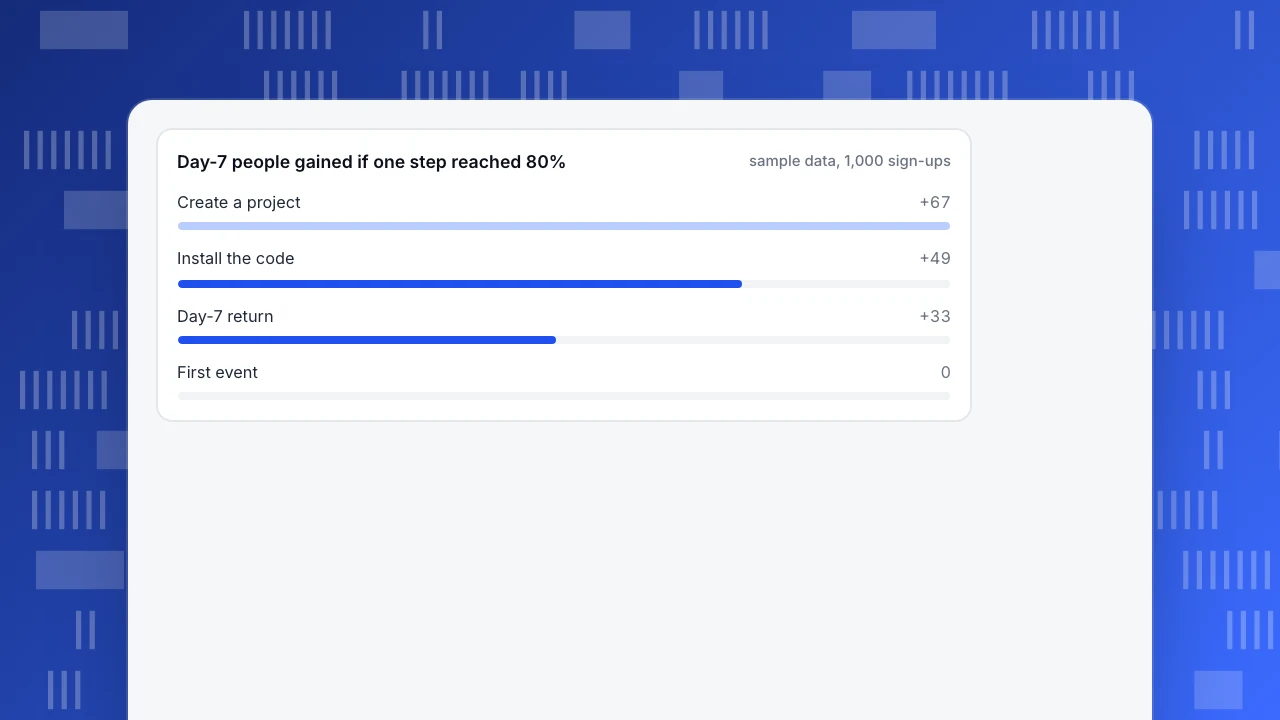
At the end, 231 of 1,000 sign-ups (23.1%) are still around on day 7. The lowest rate is the first step, and the largest loss in people is also the first (380). That is a hint, not a conclusion, because fixing a step is worth more or less depending on where it sits. Ask what the final count would be if each step reached 80%, with the others unchanged:
| If this step reached 80% | Day-7 people | Gain |
|---|---|---|
| Created a project (62.0%) | 298 | +67 |
| Installed the code (66.1%) | 280 | +49 |
| Sent a first event (80.5%) | 230 | no gain, already above 80% |
| Came back on day 7 (70.0%) | 264 | +33 |
Each figure is 1,000 multiplied by the four rates with one replaced by 0.80. The first step has the biggest ceiling, +67 people, and it is also the step with the clearest cause to investigate. The day-7 step looks attractive because 70% is the lowest rate after the first two, but lifting it means changing what people find in the product after setup, which is harder to do in a few weeks.
Day-7 people gained if one step reached 80%
sample data, 1,000 sign-upsHow do you write the hypothesis and size the test?
Write it as evidence, change, metric, group and result: because [what the data shows], we believe [change] will move [metric] for [group], and we will know when [result].
Suppose the replays of people who stopped at the first step show them staring at an empty project form. The hypothesis could be: because 380 of 1,000 sign-ups never create a project and the recordings show an empty form, we believe a prefilled project name and a template will raise the create-a-project rate from 62% to 72% for new sign-ups, and we will know after 343 sign-ups per variant.
The sample size comes from how big a change you need before it is worth shipping, because small changes need many people to detect. At 5% significance and 80% power, the standard two-proportion calculation gives:
| Target rate from 62% | Lift | People per variant | Months at 1,000 sign-ups a month |
|---|---|---|---|
| 72% | +10 points | 343 | 0.7 |
| 67% | +5 points | 1,434 | 2.9 |
Halving the effect you want to detect more than quadruples the people you need. If a +5-point lift is the smallest worth shipping and you can wait only a month, a test cannot answer the question in that time; ship the change with a guardrail and watch the trend instead, or aim at a bigger change.
How many experiments should you expect to waste?
Plan for most of them not to win. If roughly a third of ideas move their metric, as the Bing team reported for its own tests, then on average you need three experiments for one win. At 0.7 months per test on this step, that is about 2.1 months per win. That arithmetic changes how you plan:
- Queue several hypotheses for each gap instead of betting a quarter on one.
- Keep each change small, so that a miss costs weeks, not months.
- Count a clean negative as a result. It tells you the cause was not the one you guessed, and it goes into the log.
Do not treat the one-third figure as a forecast for your own product; it comes from a search engine with millions of users and a highly tuned product. Use it as a reminder to budget for misses and measure your own hit rate after about ten experiments.
How do you read feature adoption?
Funnels are for ordered journeys; for features people use at will, use adoption. Feature adoption is the share of active users who used the feature in the period.
Sample data: 2,000 active users in a month, and the 28-day retention of those who used each feature compared with those who did not.
| Feature | Users | Adoption | Retention: users vs non-users | Reading |
|---|---|---|---|---|
| Dashboards | 1,240 | 62.0% | 61% vs 49% | Core feature, widely used |
| Funnels | 700 | 35.0% | 64% vs 49% | Good lift, room to grow adoption |
| Segments | 360 | 18.0% | 70% vs 51% | Big lift, low adoption: a discovery problem |
| Alerts | 180 | 9.0% | 72% vs 54% | Big lift, low adoption: a discovery problem |
| Exports | 140 | 7.0% | 55% vs 56% | No lift: do not invest, or ask who needs it |
A feature with low adoption and a large retention difference is the classic candidate for optimization, because the people who find it stay. Read that with care: people who use more features are usually more engaged to start with, so the difference is a signal to test, not proof that the feature causes retention. The test is to make the feature easier to find for a random half of new users and compare their retention with the other half.
| Feature | Adoption | Retention: users vs non-users | Reading |
|---|---|---|---|
| Dashboards | 62.0% | 61% vs 49% | Core feature |
| Segments | 18.0% | 70% vs 51% | Big lift, low adoption: discovery problem |
| Alerts | 9.0% | 72% vs 54% | Big lift, low adoption: discovery problem |
| Exports | 7.0% | 55% vs 56% | No lift: do not invest yet |
Sample data: 2,000 active users; 28-day retention. Differences between users and non-users are a signal to test, not proof of cause.
How do you run the loop in TapCub?
Take the onboarding sample. TapCub supplies the measurement for steps 1, 2 and 5. It does not run experiments or split traffic, so the change itself is shipped or tested with your own release process.
- Define the journey as a funnel. In All-platform analytics › Behavior › Behavior analysis, build the four steps with a window of up to 180 days (default 7). Each step shows the count, the rate versus step one and the previous step, the drop-off and the median time; the largest drop is marked. Break it down by source or device to see whether the gap is the same everywhere.
- Set activation to a real action. In the business settings for All-platform analytics › Business › AARRR growth, map activation to "finished onboarding" or "used the core feature once", not a page view, so the activation stage reflects your gap.
- Read adoption and retention. Use event analysis to chart each feature event by unique people or active percent, and the retention report for day-7 or week-4 return, optionally starting from an event.
- Mark each release and guard the guardrail. Add the release date in Configuration › Annotations. Create a monitor on a saved metric such as support-related events, with a dry run first, so a guardrail slipping triggers a notification.
- Keep the log. TapCub does not store your hypotheses, so keep the decision log next to your team's tracker and note the dates that match the annotations.
FAQ
What is product optimization?
Product optimization is the continuing work of improving an existing product so more users get value and come back. It follows a loop: pick a metric, find the biggest gap, write a hypothesis, make a small change, read the result and decide what to do next.
How do you optimize a product with data?
Pick one metric and one guardrail, build a funnel or adoption chart to find the weakest step, estimate the people gained by fixing each step, then test a small change on the best one. Use the result to decide whether to keep, revise or drop it.
How do you choose which metric to optimize?
Start from the product goal and map it to signals and metrics, as Google's HEART framework suggests, then keep the metrics that behavior data can measure: adoption, retention and task success. Choose one primary metric for the cycle and name one guardrail.
How many product experiments will win?
Often few. A Bing team reported that less than a third of its tested ideas moved the metrics they were meant to improve. Your rate will differ, so plan for several hypotheses per gap and measure your own hit rate after about ten experiments.
Sources
- Kerry Rodden, Hilary Hutchinson and Xin Fu, Measuring the User Experience on a Large Scale: User-Centered Metrics for Web Applications, CHI 2010 — the HEART framework and the goals-signals-metrics process. Checked 2026-11-21.
- Bing Blogs, Large Scale Experimentation at Bing (2013) — less than a third of ideas move the metrics they were designed to improve. Checked 2026-11-21.
- NIST/SEMATECH e-Handbook of Statistical Methods, 7.3.3 Do two processes produce the same proportion of defectives? — the two-proportion test behind the sample sizes. Checked 2026-11-21.
Was this article helpful?
We use your answers to fix and expand this page.
Couldn’t send. Please try again in a minute.
Thanks for the feedback. We’ll use it to improve this page.You’ve already sent feedback on this page. Thanks.

Product Experience Specialist
Writes about product experience, practical workflows, and growth, turning complex processes into clear steps for everyday decisions.