Try it on your own data
Every report in this article is in the free plan. One snippet for web and apps, up to 10 sites.
Start freeA and B testing splits visitors at random between version A and version B, runs both at the same time and compares one metric chosen in advance. To run one well, fix the sample size before you start, run whole weeks, check the split, read the confidence interval rather than only the p-value, and look once. The worked test below needs 17,943 visitors per group for a 4.0% to 4.6% lift and ends with a +0.08 to +0.91 point interval.
What you will learn
- Set the sample size from baseline, smallest worthwhile lift, 5% significance and 80% power before launch: 4.0% to 4.6% needs 17,943 visitors per group
- Round the run up to whole weeks, check the split ratio, then read the confidence interval rather than only the p-value
- Looking five times and stopping at the first p < 0.05 turned a 5% false-win rate into 14.55% in our simulation
What is A and B testing, and when is it the right tool?
A and B testing (also written A/B testing) is a randomised controlled experiment: visitors are assigned by chance to version A (the control) or version B (the change), both versions run at the same time, and you compare one pre-chosen metric between the two groups. Random assignment is what makes the comparison fair. Anything else that differs between the groups, such as device, source or mood, is spread evenly by chance, so a gap in the metric can be blamed on your change.
That is different from a before-and-after comparison, where this week runs on the old page and next week on the new one. A before-and-after number mixes your change with the weather, a newsletter, a holiday and a price change at a competitor. Researchers who have run thousands of online experiments describe a rule they call Twyman's law: "any figure that looks interesting or different is usually wrong" (Kohavi et al., 2014). A parallel test is the cheapest defence.
A test is the right tool when three things hold:
- You have a decision to make. "Do we ship the shorter sign-up form?" is a decision. "Let's see what happens" is not.
- You can reach the sample size in a reasonable time. If the calculation below says 40 weeks, do not run the test. Make a bigger change, test on a higher-traffic page, or decide on judgement and measure afterwards.
- The change is independent per visitor. Pricing that differs between neighbours, or a feature one colleague shows to another, contaminates the groups.
If any of these fail, skip to the before-and-after caveats instead of running a weak test.
How do you write the hypothesis and choose the metric?
Write four things down before the test starts, because changing any of them after you see data is a source of false wins:
| Item | Example in this guide | Why it matters |
|---|---|---|
| Hypothesis | Replacing the 7-field sign-up form with a 3-field form raises completed sign-ups | States the direction and the reason |
| Primary metric | Sign-ups divided by visitors who saw the form | One number decides the test |
| Guardrail metric | Share of new accounts that confirm their email within 24 hours | Catches a win that brings worse leads |
| Unit | Visitor, assigned once, kept in the same group on return visits | Prevents the same person seeing both versions |
Choose a primary metric that moves quickly enough to read inside a few weeks. A test that needs "12-month retention" as its primary metric is a cohort study, not an A/B test. Use a proxy that you have evidence predicts the long metric, and keep the long metric as a guardrail.
The example below runs through the whole test with one set of numbers: a baseline sign-up rate of 4.0% on the form page, a hoped-for lift to 4.6% (a 15% relative lift), 1,500 eligible visitors a day, and a split of 50 / 50. All numbers are sample data, and every calculation was recomputed in Python.
How many visitors do you need in each group?
The sample size depends on four inputs you choose and one you do not control. You choose the baseline rate (4.0%), the minimum detectable effect (the smallest lift worth finding, here 4.0% to 4.6%), the significance level (5%, two-sided) and the power (80%, the chance of detecting the lift if it is real). The one you do not control is how noisy the metric is, which for a conversion rate follows from the baseline itself.
For two conversion rates p1 and p2, the standard normal-approximation formula for visitors per group is:
n = (z(1-α/2) × √(2 × p̄ × (1 - p̄)) + z(power) × √(p1 × (1 - p1) + p2 × (1 - p2)))² ÷ (p2 - p1)²
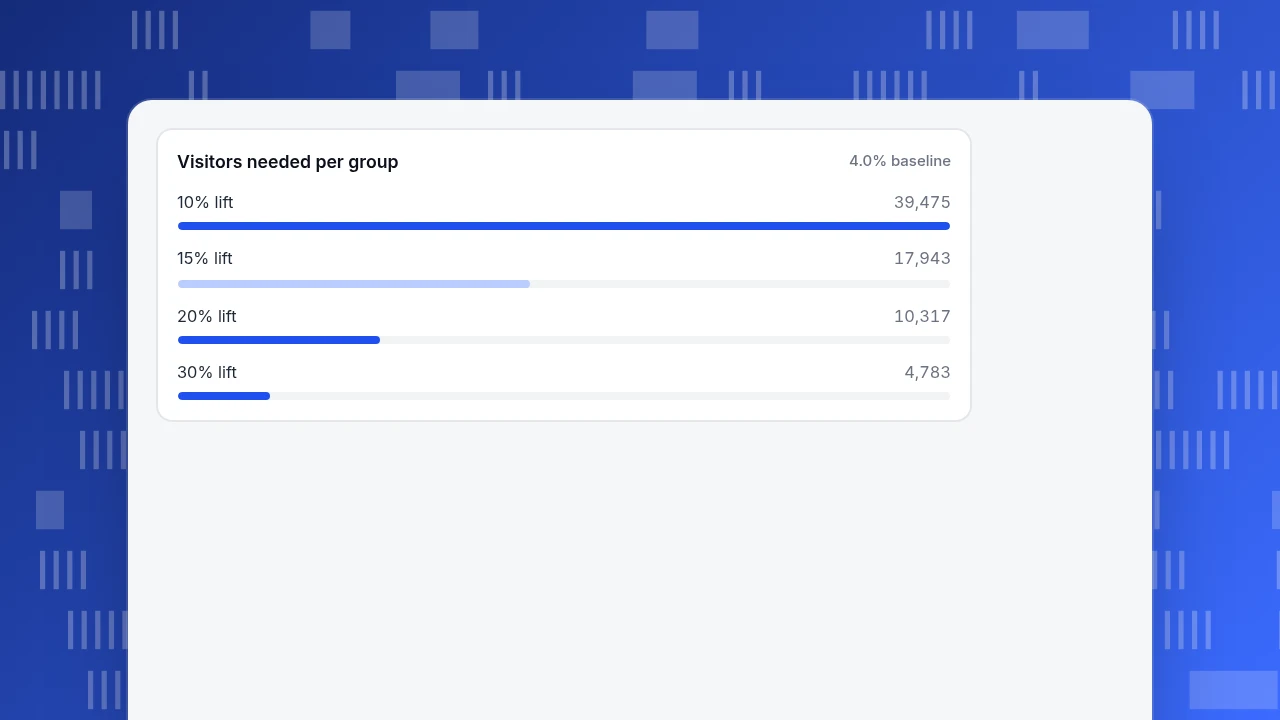
where p̄ is the average of p1 and p2, z(0.975) = 1.960 and z(0.80) = 0.842. For 4.0% versus 4.6%: p̄ = 4.3%, and the formula gives 17,943 visitors per group, so about 36,000 visitors in total.
The smaller the lift you want to detect, the bigger the test. Required size grows roughly with the inverse square of the lift: halve the lift and you need about four times the visitors.
| Relative lift to detect | Variant rate | Visitors per group | Visitors in total | Days at 1,500 a day | Rounded up to whole weeks |
|---|---|---|---|---|---|
| 10% | 4.4% | 39,475 | 78,950 | 52.6 | 8 weeks |
| 15% | 4.6% | 17,943 | 35,886 | 23.9 | 4 weeks |
| 20% | 4.8% | 10,317 | 20,634 | 13.8 | 2 weeks |
| 30% | 5.2% | 4,783 | 9,566 | 6.4 | 1 week |
Treat this as a working estimate, not a guarantee. Published calculators differ by 10–20% because they make different assumptions. One vendor's documentation, for a 5% baseline, lists about 12,000, 26,000 and 100,000 visitors per offer for 15%, 10% and 5% relative lifts (Adobe Target); the two-sided formula above gives 14,193, 31,233 and 122,123 for the same inputs. The pattern is what matters: the smaller the lift, the sharply bigger the test.
Two warnings about metrics that are not simple conversion rates. Revenue per visitor and similar averages usually need more visitors than a conversion rate (the same vendor suggests roughly 20–30% longer), and heavily skewed metrics need more again; the Microsoft, Amazon, Booking.com and LinkedIn authors give a rule of thumb of 355 × s² observations per variant when the skewness s of the metric exceeds 1 (Kohavi et al., 2014).
Visitors needed per group
4.0% baselineHow long should the test run?
Divide the total sample by daily eligible traffic, then round up. For the 15% design: 35,886 ÷ 1,500 = 23.9 days, rounded up to 28 days (four whole weeks).
Rounding up to whole weeks is not cosmetic. Behaviour differs by day of week, so a test that ends on a Tuesday after starting on a Thursday over-weights some days. One vendor tells users to round the required time up to the nearest whole week for this reason (Adobe Target); another recommends a minimum of one business cycle, which it defines as seven days (Optimizely); the authors of the 2014 rules-of-thumb paper report that each experiment they present "ran for at least a week" with stable variant proportions (Kohavi et al., 2014).
Use these rules to set the end date:
- Compute the days from the sample size, then round up to whole weeks. Never set the end date from "when it looks significant".
- Cover one full business cycle at minimum. If your buyers take three weeks to decide, a one-week test measures only the quickest buyers.
- Avoid known disturbances. A sale, a newsletter blast or a pricing change in the middle of the test hits both groups equally in expectation, but it can change who is in the test. Note them in a log and consider restarting if they are large.
- Stop at the planned date, not before and not after. Extending until the result "firms up" is peeking by another name (see below).
| Relative lift to detect | Visitors per group | Days at 1,500 visitors a day | Run for |
|---|---|---|---|
| 10% (4.0% to 4.4%) | 39,475 | 52.6 | 8 weeks |
| 15% (4.0% to 4.6%) | 17,943 | 23.9 | 4 weeks |
| 20% (4.0% to 4.8%) | 10,317 | 13.8 | 2 weeks |
| 30% (4.0% to 5.2%) | 4,783 | 6.4 | 1 week |
Two-sided 5% significance, 80% power, 50 / 50 split, rounded up to whole weeks. Halving the lift roughly quadruples the visitors.
How do you split the traffic and check the split worked?
Use an equal split, 50 / 50, unless you have a reason not to. The authors of the rules-of-thumb paper make the same recommendation: with equal sizes the distribution of the difference is approximately symmetric (Kohavi et al., 2014).
Assign each visitor once and keep them in the same group for the whole test. Store the assignment in a first-party cookie or, for logged-in users, against the user ID, so a returning visitor sees the same version.
Then run a sample ratio check before you look at any conversion numbers. If you intended 50 / 50 and the groups differ by more than chance explains, the assignment or the tracking is broken and the result cannot be trusted. In the example the test finished with 18,040 visitors in A and 17,960 in B. The expected count in each group is 18,000, so:
chi-square = ((18,040 − 18,000)² + (17,960 − 18,000)²) ÷ 18,000 = 0.178, which gives p = 0.67
A p-value that large means the split is consistent with a fair coin. A very small value (many teams use 0.001 as the alarm) would mean you should stop and find the bug: bots that only one version triggers, a redirect that drops tracking on one side, or an assignment that depends on the browser.
Also keep bots out of the denominators. Crawlers inflate visitor counts and have no conversions, which drags both rates down and makes the test less sensitive. The rules-of-thumb paper states its sample sizes are counted "after bot removal".
How do you read the result?
Final counts for the example, after the planned four weeks:
| Group | Visitors | Sign-ups | Rate |
|---|---|---|---|
| A (7 fields) | 18,040 | 722 | 4.002% |
| B (3 fields) | 17,960 | 808 | 4.499% |
Work through it in five steps.
- Difference. 4.499% − 4.002% = 0.497 percentage points, a relative lift of 12.4%.
- Pooled rate. (722 + 808) ÷ (18,040 + 17,960) = 4.250%.
- Standard error under "no difference". √(0.0425 × 0.9575 × (1/18,040 + 1/17,960)) = 0.00213.
- z-score. 0.00497 ÷ 0.00213 = 2.34, which corresponds to a two-sided p-value of 0.0195.
- Confidence interval for the difference. Using unpooled standard error 0.00212: 0.497 ± 1.96 × 0.212 = 0.08 to 0.91 percentage points, or 2.0% to 22.8% relative.
The p-value of 0.02 is below the 0.05 you chose in advance, so the lift is statistically significant. The interval is the more useful part. It says the true effect is plausibly anywhere from nearly nothing to a 23% relative lift, and the observed 12.4% sits below the 15% you designed for. That is a normal outcome: the test was sized to detect a 15% lift with 80% power, so it can still detect smaller effects, but with less precision.
Two cautions before you celebrate. First, the interval's lower edge is close to zero, so plan the business case on the low end (+2% relative), not the point estimate. Second, apply Twyman's law: if the lift is enormous, hunt for a tracking bug before you believe it. Real breakthrough effects are rare. The same paper works through a case: if typical effects are centred on zero with a standard deviation of 0.25%, a +2.0% change is eight standard deviations from the mean, so even a significant result should send you looking for an instrumentation bug rather than celebrating (Kohavi et al., 2014).
For the statistics behind the p-value, see statistical significance.
What happens if you peek and stop early?
A fixed-sample test is valid only if you look once, at the end. Each additional look at the p-value gives chance another opportunity to cross 0.05.
To see the size of the problem, we simulated 4,000 A/A tests in Python (two identical groups with a 4.0% rate, 18,000 visitors each, random seed fixed). Looking once at the end, 4.35% of tests reported a "significant" difference, close to the nominal 5%. Looking five times at equal intervals and stopping at the first p < 0.05, 14.55% did. The same traffic, the same identical groups, and the false-win rate roughly tripled.
The practical rules:
- Fixed-sample test (this guide): decide the end date up front and read the result once. Peeking at a dashboard is harmless if you do not act on it.
- Sequential methods: if you must be able to stop early, use a method designed for it (sequential or always-valid testing), not a fixed-sample test read many times. One vendor's documentation describes this approach and warns that underpowered results can look promising, yet the improvement often fails to hold after launch (Optimizely).
- Lower confidence is a choice, not a trick. Dropping to 90% confidence gets answers sooner at the price of more false positives; it can be acceptable only when a wrong call is cheap to reverse.
Adobe's documentation also warns that testing five offers against a control at 95% confidence gives about an 18.5% chance of at least one false positive. If you test many variants or many metrics, divide your significance threshold or pick one primary metric.
Which result do you ship?
Decide using the interval, a guardrail and the cost of being wrong, not the p-value alone.
| Outcome | Interval for the lift | Guardrail | Decision |
|---|---|---|---|
| Clear win | Lower edge above your smallest worthwhile lift | Flat or better | Ship it |
| Significant but small | Lower edge above zero, below the smallest worthwhile lift | Flat | Ship if free to maintain; do not expect the point estimate |
| Inconclusive | Interval spans zero | Flat | Treat as "no detectable effect"; decide on cost and judgement |
| Significant loss | Upper edge below zero | Any | Keep A; learn why before trying again |
| Win with a worse guardrail | Lower edge above zero | Worse | Do not ship until you understand the trade-off |
For the example, the 3-field form is a significant but small win with a lower edge of +2% relative. The cost of shipping is near zero (fewer fields to maintain), the guardrail needs checking first (email confirmation within 24 hours), and the business case should use +2% to +12%, not +23%.
If you cannot run a proper test, a before-and-after comparison is better than nothing, but write down what else changed in the period, compare the same weekdays, and treat the result as a hypothesis. A "no effect" result is still useful: it tells you where not to spend the next month.
How do you measure the two variants in TapCub?
TapCub does not run A/B tests: it has no experiment builder, no traffic splitting and no feature flags. Your own tool, or your own code, assigns visitors to A or B. TapCub's job is to measure what happened in each group. For the sign-up example, the workflow is:
- Send the variant with the events. Have your page code pass the assigned version (for example
form_variant = aorb) as a property on the events that matter, the form view and the sign-up. Use the same names on both versions. - Count each group's visitors and conversions. In All-platform analytics › Behavior › Event analysis, pick the sign-up event and break it down by the variant property. Do the same for the form-view event to get visitors in each group, or build a two-step funnel in All-platform analytics › Behavior › Behavior analysis and compare the conversion rate with a filter on each variant.
- Do the sample-ratio check from the totals. Compare the two visitor counts with the split you intended, using the chi-square calculation above. Bots are recognised and reported separately in Web analytics › Bots, so they do not inflate either group's visitor count.
- Read the interval with your own calculation. TapCub reports the counts and rates; the confidence interval and p-value come from the formulas above or from your testing tool.
- Mark the dates. Add the test start and end, and any campaign or release that happened during it, as annotations under Configuration › Annotations so the team can see what else changed.
FAQ
What is the difference between A/B testing and multivariate testing?
An A/B test compares one change between two versions. A multivariate test varies several elements at once and estimates each element's effect and their interactions, which needs far more traffic. With the sample sizes in this guide, run one change at a time.
How long should an A/B test run?
Long enough to reach the planned sample size, rounded up to whole weeks, and never less than one full business cycle (seven days). In the example, 35,886 visitors at 1,500 a day takes 23.9 days, so the test runs four weeks.
What sample size do you need for an A/B test?
It depends on your baseline rate, the smallest lift worth detecting, 5% significance and 80% power. For a 4.0% baseline and a 15% relative lift the formula gives 17,943 visitors per group; for a 10% lift it is 39,475.
Can you run an A/B test with low traffic?
Only for large changes. At 300 visitors a day, a 30% relative lift on a 4.0% baseline needs 4,783 per group, about 32 days. A 10% lift would take over 260 days, so decide on judgement instead.
Is a multi-armed bandit better than A/B testing?
A multi-armed bandit shifts traffic toward the better version while it runs, which reduces the cost of showing the loser. It gives a less clean estimate of the size of the difference, so use a fixed A/B test when the number matters for a decision.
Sources
- Kohavi, R., Deng, A., Longbotham, R., Xu, Y. (2014). Seven Rules of Thumb for Web Site Experimenters. KDD 2014 (DOI 10.1145/2623330.2623341).
- Adobe Experience League. How long should you run an A/B test? (sample size determination). Adobe Target documentation, read 2026-11-20.
- Optimizely Docs. How long to run an experiment. Read 2026-11-20.
Was this article helpful?
We use your answers to fix and expand this page.
Couldn’t send. Please try again in a minute.
Thanks for the feedback. We’ll use it to improve this page.You’ve already sent feedback on this page. Thanks.

Data Analyst
Explores traffic sources, conversion funnels, and retention, using clear metric definitions and concrete examples to explain what the numbers mean.