Try it on your own data
Every report in this article is in the free plan. One snippet for web and apps, up to 10 sites.
Start freeWebsite traffic statistics count what happens on a site, and every count depends on a definition: what is one visitor, how a session is cut and whether bots are in. Change the definition and the same traffic gives a different number. Below: the metrics, why totals differ, how bots and session rules move them, and when a change is real.
What you will learn
- Every traffic number needs its definition: identity, session rule and bot handling
- In the sample, bots made the conversion rate look 1.64% instead of 2.00%, and daily visitors summed to 2,470 for 1,350 people
- Treat changes smaller than about 2 ÷ √n as noise, and test any published statistic for who, what, when and fit
What do website traffic statistics actually count?
Website traffic statistics are counts of what happened on your site, and each count has a definition that changes the number. The five you will meet in almost every report are pageviews, sessions, visitors (or users), new versus returning, and bounce or engagement. A traffic number without its definition is not comparable to anything.
| Statistic | What it counts | The definition detail that moves it |
|---|---|---|
| Pageviews | Each time a page is loaded or a route changes in a single-page app | Whether route changes count |
| Sessions | One continuous visit | Idle timeout; Google Analytics and TapCub both default to 30 minutes |
| Visitors or users | Distinct people, devices or browsers | What is the identity: a cookie, a device, a login, a daily hash |
| New vs returning | Whether it is the first time the identity was seen | Needs identity to persist across days |
| Bounce or engaged rate | Share of sessions that left at once, or stayed 10 seconds or two pages | The cut-off and what counts as an interaction |
Google's own help page defines a session as a period of time during which a user interacts with your site or app, with a default timeout of 30 minutes of inactivity and no limit on how long a session can last. Its separate user-metrics page defines total users, active users, new users and returning users as four different numbers. Four numbers with "users" in the name will never agree, and that is by design.
This guide is about reading the numbers, not collecting benchmark averages. The three things that move a traffic number most are the definition of "visitor", the session rule, and whether bots are in or out. The sections below take each in turn. For where to find your own figures, see how to check website traffic.
| Statistic | What it counts | The definition detail that moves it |
|---|---|---|
| Pageviews | Each page load or route change | Whether route changes count |
| Sessions | One continuous visit | Idle timeout, often 30 minutes |
| Visitors or users | Distinct people, devices or browsers | Cookie, device, login or daily hash |
| New vs returning | First time the identity was seen | Identity must persist across days |
| Bounce or engaged rate | Sessions that left at once, or stayed 10 seconds or two pages | The cut-off and what counts as interaction |
Compare numbers only when their definitions match.
Why do visitor totals differ between tools, and even inside one tool?
Three reasons, from the most to the least obvious.
1. The identity is different. A cookie-based tool counts a browser, a login-based tool counts a person, and a cookieless tool may count a daily or site-level hash. The same real people produce different totals under each. See why UV never matches for the full walk-through and UV for the term.
2. The period is added up, not de-duplicated. Many overview cards add each day's unique visitors. A person who visits on three days counts three times in that sum, although they are one person.
Sample data: daily visitors for one week are 420, 390, 410, 450, 380, 220 and 200.
| Day | Visitors |
|---|---|
| Mon | 420 |
| Tue | 390 |
| Wed | 410 |
| Thu | 450 |
| Fri | 380 |
| Sat | 220 |
| Sun | 200 |
| Sum of daily visitors | 2,470 |
| Distinct people across the week (assumed) | 1,350 |
The card that adds the days shows 2,470; the number of distinct people is 1,350. The ratio is 2,470 ÷ 1,350 = 1.83 visitor-days per person. Neither number is wrong; they answer different questions. The monthly version of this gap is covered in unique monthly visitors.
3. Blockers, consent and bots. A blocked script drops visits, a consent banner can remove some, and automated visits add some. The next section deals with the last one.
How do bots change the numbers?
Bots inflate the denominator of every rate. They load pages, rarely convert and often leave at once, so they push conversion rate down and bounce rate up, and they add to pageview counts.
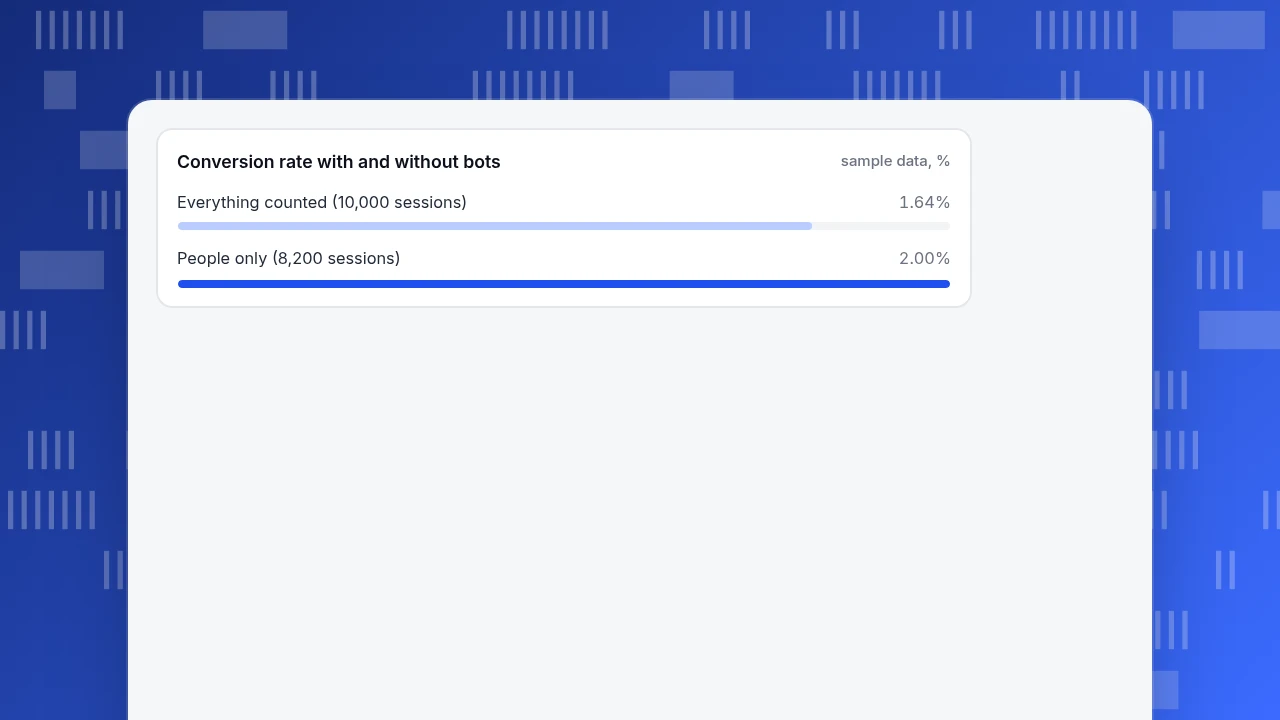
Sample data: a site records 10,000 sessions, of which 1,800 are bots and 8,200 are people. The 164 conversions all came from people.
| Measure | Everything counted | People only |
|---|---|---|
| Sessions | 10,000 | 8,200 |
| Conversion rate | 164 ÷ 10,000 = 1.64% | 164 ÷ 8,200 = 2.00% |
| Bounce rate (bots 95%, people 52%) | (1,800 × 0.95 + 8,200 × 0.52) ÷ 10,000 = 59.7% | 52.0% |
With bots included the conversion rate looks 18% lower than it is (1.64 vs 2.00) and the bounce rate nearly eight points too high. Nothing about the real audience changed.
Different tools handle this differently, and mostly out of sight. Google Analytics automatically excludes traffic from known bots and spiders, identified through Google's research and the Interactive Advertising Bureau's International Spiders and Bots List; you cannot turn this off, and it does not show how much it removed. Whatever tool you use, find out whether bots are excluded, what list is used, and whether the count of excluded visits is visible. A script-based tool only sees bots that run JavaScript; many crawlers do not, so their visits need server logs to be seen at all. See bot filtering for the term.
Conversion rate with and without bots
sample data, %How does the session rule change the count?
A session is not a natural unit. It is a rule that cuts a stream of events into visits, and the rule decides the count. The most common rule is an idle timeout: a gap longer than the timeout starts a new session.
Sample data: one visitor has events at 9:00, 9:20, 9:55 and 10:40, with gaps of 20, 35 and 45 minutes.
| Idle timeout | Sessions | How the events split |
|---|---|---|
| 30 minutes | 3 | 9:00 and 9:20 together; 9:55 alone; 10:40 alone |
| 40 minutes | 2 | 9:00, 9:20 and 9:55 together; 10:40 alone |
| 60 minutes | 1 | All four events in one session |
The same behaviour produces 3, 2 or 1 sessions. Other rules matter as well: whether a session splits at midnight, whether a new traffic source mid-visit starts a new session, and whether there is a maximum session length. When two tools disagree on sessions but agree on pageviews, compare the session rules first. The term is in session and session timeout.
When is a change in traffic real?
Traffic counts have random variation even when nothing changed. If visits arrive independently, a count of n varies by about the square root of n, which is 1 ÷ √n of the count. A change within about twice that is hard to tell from noise.
| Weekly visits | One standard swing (1 ÷ √n) | Change you should treat as noise (about 2 ÷ √n) |
|---|---|---|
| 400 | 5.0% | up to about 10% |
| 4,200 | 1.5% | up to about 3.1% |
| 10,000 | 1.0% | up to about 2.0% |
Sample data: a site had 4,200 visits last week and 4,620 this week. The change is (4,620 − 4,200) ÷ 4,200 = +10.0%. With 4,200 visits the noise band is about 3.1%, so a 10.0% rise is probably real. On a site with 400 weekly visits, a 4% move is well inside the 10% band and means nothing.
Two habits follow. Compare the same period (this Tuesday with last Tuesday, not with Sunday), because weekly rhythm is bigger than noise. And mark known causes, such as a launch or a campaign, so that you can tell a planned rise from a surprise.
Should you rely on published website traffic statistics?
Be cautious. Roundups of traffic statistics tend to copy figures from one another, mix definitions and carry old numbers forward without a date. A figure such as the average share of traffic from organic search depends on which sites were measured, how channels were defined and when. It describes that sample, not your site, and it is not a target.
A short test for any statistic before you use it:
| Question | A pass looks like |
|---|---|
| Who measured it? | A named organisation, with a link to the original, not a roundup of roundups |
| What population? | A stated set of sites or visits, and how many |
| What definition? | Visitor, session and bot treatment spelled out |
| When? | A date within the last year, for something that changes fast |
| Does it fit you? | Similar size, industry and traffic mix |
If a statistic fails two or more questions, leave it out. The better benchmark is your own history: last month, the same month last year, and the same weekday. There is no reliable single answer to "how much traffic should a website get?"; it depends on what the site is for. To judge your own number, compare it with your own past and with your goal, as in unique monthly visitors.
What mistakes make traffic statistics misleading?
- Comparing totals across tools. Different identity, bot and session rules produce different totals. Compare the trend shape and the top pages instead.
- Reading the sum of daily visitors as people. In the example, 2,470 daily visitors were 1,350 people.
- Including bots in rates. In the example, conversion rate was 1.64% instead of 2.00%.
- Ignoring a changed rule. If the session timeout or channel rules changed, the line breaks on that date. Mark it.
- Treating small movements as news. A 4% move on 400 visits is noise.
- Quoting a statistic without date or definition. If you cannot say what was counted and when, do not use it.
How to read traffic statistics in TapCub
Here is how the examples above look in TapCub.
- Start from the definitions. TapCub documents how each metric is counted. Visitors are de-duplicated on the visitor ID by default; sessions use a 30-minute idle timeout and a 24-hour maximum, and do not split at midnight, though arriving mid-session from a different external source does by default. Engaged means at least 10 seconds or two pageviews, and a bounce is one pageview and no custom event.
- Read the overview. Open Web analytics › Overview for visitors, sessions, pageviews, bounce and duration. The visitor card adds each day's visitors, so it behaves like the 2,470 in the example.
- Get the distinct people. In Web analytics › Reports, for ranges of 93 days or less the data report also shows visitors de-duplicated across the whole range, which is the 1,350 in the example.
- Keep bots out of the rates. New projects default to recognising bots and reporting them separately in Web analytics › Bots, so recognised bots do not enter human visitors, sessions or pageviews. With only the page script, TapCub sees bots that run JavaScript; crawlers that do not need server collection or a log import.
- Check the sessions. Web analytics › Sessions lists the visits cut by the rules above. If a comparison with another tool looks off, start with why the visitor count differs from GA4, which compares bots, identity, sessions and consent.
One limit to know: in the strict privacy mode, the identity changes every day, so the same person cannot be matched across days and new-versus-returning is unavailable. TapCub reports what its script collected; it does not estimate traffic it cannot see, and it does not provide industry averages.
FAQ
What are website traffic statistics?
Website traffic statistics are counts of what happens on a site: pageviews, sessions, visitors, their sources, and measures such as bounce or engagement. Each depends on a definition, such as what counts as one visitor or how long a gap ends a session, so a number is only meaningful with its definition and its time period.
How do you check website traffic statistics?
Use the analytics tool installed on your site and read visitors, sessions, pageviews and sources over a stated period. For a site that does not have one, a hosting panel's logs give a rough view, but they include bots. Compare periods in the same tool; do not mix tools.
What is the difference between visits and visitors?
A visit, or session, is one continuous period of activity. A visitor is the identity behind it, a person, device or browser depending on the tool. One visitor can make several visits. In the sample week, 2,470 daily visitors came from 1,350 people.
Why do two analytics tools show different traffic?
Because they define visitor, session and bot handling differently, and may be affected differently by blockers and consent. Totals will rarely match. Compare the trend shape week over week and the ranking of top pages, which should be similar.
Do bots count in website traffic statistics?
It depends on the tool and its settings. Some exclude known bots automatically and some report them separately, while others include them. Including them lowers conversion rates and raises bounce rates, as in the sample, where the conversion rate was 1.64% instead of 2.00%. Check what your tool does and whether the excluded amount is visible.
See also: What is APAC? Countries by subregion and how to report on the region.
See also: How Many Visitors Does a Website Get? A Rank-to-Traffic Model.
See also: Public Website Traffic Data: Where to Find It and How Reliable It Is.
Sources
- Google. About Analytics sessions, Analytics Help. Session definition and the default 30-minute timeout. Checked 2026-11-19.
- Google. Understand user metrics, Analytics Help. Definitions of total, active, new and returning users. Checked 2026-11-19.
- Google. Known bot-traffic exclusion, Analytics Help. Automatic exclusion of known bots and spiders. Checked 2026-11-19.
Was this article helpful?
We use your answers to fix and expand this page.
Couldn’t send. Please try again in a minute.
Thanks for the feedback. We’ll use it to improve this page.You’ve already sent feedback on this page. Thanks.

Product Experience Specialist
Writes about product experience, practical workflows, and growth, turning complex processes into clear steps for everyday decisions.