Try it on your own data
Every report in this article is in the free plan. One snippet for web and apps, up to 10 sites.
Start freeA website has no typical number of visitors, because traffic is spread like wealth: Ahrefs found 96.55% of about 14 billion pages got no Google traffic. Below: a rank-to-traffic model with its assumptions, random noise by site size, how bots distort counts and how to read your own number.
What you will learn
- Traffic follows a steep power law: in the model one million domains out of 292 million hold about 72% of all visits
- Check what a benchmark counts: visitors, visits and pageviews differ, and bots can be half of raw requests
- At about 100 visits a day a 10% daily swing is chance; you need about 400 visits a day to see a 5% daily change
There is no typical number: traffic is a steep slope
The honest answer to "how many visitors does a website get" is that the question has no single answer, because website traffic is not spread like heights in a room. It is spread like wealth: a few sites hold most of it and the great majority get very little.
Three published facts make the shape concrete.
- How many sites there are. Netcraft's December 2025 web server survey counted 1,389,596,802 sites on 291,965,818 domains.
- How little most pages get. Ahrefs analysed about 14 billion pages in its index in December 2023 and found that 96.55% got no traffic from Google and 1.94% got between 1 and 10 visits a month. Ahrefs warns that its sample leans toward the quality side of the web and that its traffic figures are estimates, so read this as the direction, not the exact share.
- The shape of the curve. In a classic study of one December day of AOL users in 1997, ranking sites by visitors gave a line with slope −1 on a log-log plot, the pattern known as Zipf's law, and about 70,000 sites received a single visit. The top site, Yahoo, had 129,641 visitors against 25,528 for the next. The data is old, so treat it as evidence of the shape, not of today's numbers.
So an "average site" figure is a mean pulled up by giants; the median is far lower. What helps you is to place your own site on the curve and to know how big a change you can trust.
A rank-to-traffic model for the whole web
Zipf's law with slope −1 says traffic is proportional to 1 ÷ rank: the tenth site gets a tenth of the visits of the first, the hundredth a hundredth. Sample data, a model and not a measurement: assume the rank-1 domain gets 80 billion visits a month (a round number chosen for illustration) and use the 291,965,818 domains from Netcraft.
| Rank | Share of rank-1 traffic | Monthly visits in the model |
|---|---|---|
| 1 | 100% | 80,000,000,000 |
| 100 | 1% | 800,000,000 |
| 10,000 | 0.01% | 8,000,000 |
| 1,000,000 | 0.0001% | 80,000 |
| 10,000,000 | 0.00001% | 8,000 |
| 100,000,000 | 0.000001% | 800 |
| about 146,000,000 (the median domain) | 0.0000007% | about 548 |
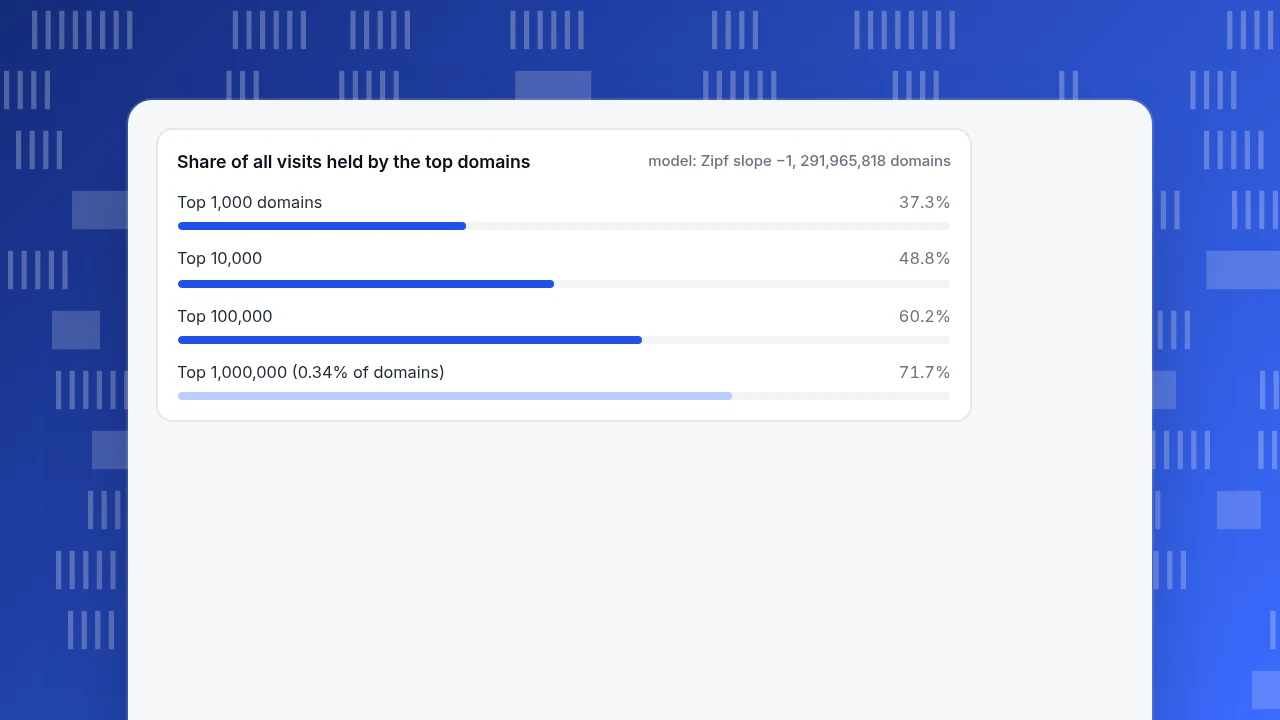
The model also shows how concentrated traffic is. With slope −1 the visits of the top k domains out of N follow the harmonic numbers, roughly (ln k + 0.577) ÷ (ln N + 0.577). For N = 291,965,818:
| Top domains | Share of all visits in the model |
|---|---|
| 1,000 | 37.3% |
| 10,000 | 48.8% |
| 100,000 | 60.2% |
| 1,000,000 | 71.7% |
One million domains is 0.34% of the domains in the survey, and the model gives them about 72% of the visits. Two ways to read the model: every tenfold step down in rank means a tenth of the visits, so doubling your traffic halves your rank number; and going from 1,000 to 10,000 visits a month moves you ten times higher in the ranking. Real data will differ from this, since traffic has regional winners and long-lived tails, but the lesson is robust: a site with 1,000 visits a month is not a failure. In this model it would rank about 80 millionth, ahead of roughly 73% of all domains.
Share of all visits held by the top domains
model: Zipf slope −1, 291,965,818 domainsVisitors, visits and pageviews are different numbers
Before comparing any number with a benchmark, check what it counts. The same traffic produces three different totals.
- Visits (sessions) are periods of activity by one browser. Each one is counted once.
- Visitors (unique visitors) are distinct people or devices in the period. One person who comes four times is one visitor and four visits.
- Pageviews are page loads, several per visit.
Sample data: 10,000 sessions in a month, 1.3 sessions per visitor and 2.4 pages per session give 10,000 ÷ 1.3 = 7,692 visitors and 10,000 × 2.4 = 24,000 pageviews. A benchmark that says "10,000 visitors" may be comparing your 7,692 visitors, your 10,000 visits or your 24,000 pageviews, depending on the source. Unique monthly visitors explains how the unique count behaves over longer windows, and website traffic statistics collects the broader published numbers.
How much of your traffic is people
Raw request counts overstate your audience. Imperva's 2025 Bad Bot Report found that automated traffic made up 51% of all web traffic in 2024, the first time in a decade it passed human activity. The share on your site depends on your size and topic, but a small site is not exempt, because crawlers visit new pages regardless of how many humans do.
Sample data: a small site's server log shows 12,000 requests to pages in a month. A tool that identifies bots and counts them separately reports 5,900 visits by people. The other 6,100 requests, 50.8%, were automated, so the "traffic" that matters for conversion is 5,900. Comparing 12,000 with a benchmark of human visits would put you in the wrong band.
Check that your tool separates known bots and AI crawlers before you quote a visitor number.
How big a change can you trust at your size
Visit counts jump around from day to day even when nothing changes. Purely random variation in a count of n events is about 1 ÷ √n, one standard deviation. Sample data: the same site at six sizes, with daily visits as monthly visits ÷ 30.
| Monthly visits | Daily visits | Daily noise (1 SD) | Monthly noise (1 SD) |
|---|---|---|---|
| 1,000 | 33 | ±17.3% | ±3.2% |
| 3,000 | 100 | ±10.0% | ±1.8% |
| 10,000 | 333 | ±5.5% | ±1.0% |
| 30,000 | 1,000 | ±3.2% | ±0.6% |
| 100,000 | 3,333 | ±1.7% | ±0.3% |
| 1,000,000 | 33,333 | ±0.5% | ±0.1% |
This is the minimum noise from chance alone; weekday patterns, campaigns and seasonality add to it. Two rules follow.
- At about 100 visits a day, a daily swing of 10% is just chance. Judge the week or the month, not the day. At about 1,000 visits a month a monthly swing of 3% or less is not a signal either.
- To see a 5% daily change reliably you need about 400 visits a day, 12,000 a month, since 1 ÷ √400 = 5%. Below that, aggregate more days before drawing a conclusion.
| Monthly visits | Daily visits | Daily noise (1 SD) | Monthly noise (1 SD) |
|---|---|---|---|
| 1,000 | 33 | ±17.3% | ±3.2% |
| 10,000 | 333 | ±5.5% | ±1.0% |
| 100,000 | 3,333 | ±1.7% | ±0.3% |
| 1,000,000 | 33,333 | ±0.5% | ±0.1% |
Sample data: random variation of a count is about 1 ÷ √n; weekday and campaign effects add to it.
How many visitors do you need for a goal
Work backwards from the outcome. Visits needed = outcomes wanted ÷ conversion rate. For 100 orders a month: at a 1% conversion rate you need 10,000 visits, at 2% 5,000 and at 3% 3,333. Because the conversion rate matters as much as the traffic, a site that doubles its conversion rate needs half the visitors for the same result, which is usually cheaper than doubling traffic. If conversion data is thin, see how the rate is calculated in the benchmarks on website traffic statistics.
Growth takes longer than it feels. Sample data: how many months of steady growth it takes to go from 1,000 to 10,000 visits a month.
| Monthly growth | Months to reach 10,000 |
|---|---|
| 5% | 48 |
| 10% | 25 |
| 15% | 17 |
| 20% | 13 |
Each figure is the first month where 1,000 × (1 + growth)^months reaches 10,000. At 10% a month, 1.1^24 gives 9,850 and 1.1^25 gives 10,830, so the target is crossed in month 25.
How to count your own visitors in TapCub
Take the 10,000-session example and read it from your own project.

- Read visitors and sessions. Open Web analytics › Overview. The cards show sessions, visitors (UV), pageviews and new visitors for the selected range, each with a comparison to the previous period.
- Check that bots are out. Recognised bots and AI crawlers are counted separately in Web analytics › Bots and do not raise the visitor and conversion figures; see are bots counted in visitors. That is the 12,000 versus 5,900 gap in the example.
- Use a long enough range. Pick the last 30 days for a site under 10,000 visits a month, and compare the same weekday or the same range, using the noise table above.
- Break down by source. Web analytics › Sources shows which channels bring the visits, so you can tell search from direct and referral traffic before comparing with an outside benchmark.
TapCub shows your numbers; it does not publish traffic rankings for other sites. For an outside comparison, use public rankings and treat them as order-of-magnitude.
FAQ
How many visitors does a website get on average?
There is no useful average, because traffic is highly uneven: a handful of giants get billions of visits and most sites get very few. Ahrefs found that 96.55% of about 14 billion pages got no Google traffic. Compare your site with its own history and with similar sites, not with a global mean.
How many visitors is good for a small website?
It depends on the goal. Work back from outcomes: 100 orders at a 2% conversion rate needs 5,000 visits a month. At around 100 visits a day, daily changes under 10% are chance, so judge by week or month. Growth over three months matters more than a single level.
How many visitors does a new website get?
Most new sites start with very few: Ahrefs found that 1.94% of pages got 1 to 10 visits a month and most got none from Google. New sites usually gain traffic from direct, referral and social sources before search. Expect weeks to months before organic search sends meaningful volume.
What is the difference between visits and visitors?
A visit is a period of activity; a visitor is a distinct person or device. One person who comes four times in a month is four visits and one visitor. With 1.3 visits per visitor, 10,000 visits are about 7,692 visitors. Always check which one a benchmark means.
How do I check how many visitors my website gets?
Use a web analytics tool and read visitors and sessions for a fixed range, with bots excluded. Check that the tool separates known bots, and compare weeks rather than single days when your traffic is small. Search Console shows only visits from Google search.
See also: Public Website Traffic Data: Where to Find It and How Reliable It Is.
Sources
- Netcraft, December 2025 Web Server Survey: 1,389,596,802 sites and 291,965,818 domains. Checked 2026-11-20.
- Ahrefs, 96.55% of Content Gets No Traffic From Google, 1 December 2023: about 14 billion pages, 96.55% with no Google traffic, 1.94% with 1 to 10 visits, and the stated limits of the sample. Checked 2026-11-20.
- Lada Adamic, Zipf, Power-laws, and Pareto: a ranking tutorial: AOL visits to sites on a December day in 1997, slope −1, Yahoo 129,641 visitors against 25,528 for the next site. Checked 2026-11-20.
- Imperva, 2025 Imperva Bad Bot Report, 15 April 2025: automated traffic was 51% of all web traffic in 2024. Checked 2026-11-20.
Was this article helpful?
We use your answers to fix and expand this page.
Couldn’t send. Please try again in a minute.
Thanks for the feedback. We’ll use it to improve this page.You’ve already sent feedback on this page. Thanks.

Data Engineer
Writes about event design, data quality, and collection workflows, with verifiable implementation methods for reliable analytics.