Try it on your own data
Every report in this article is in the free plan. One snippet for web and apps, up to 10 sites.
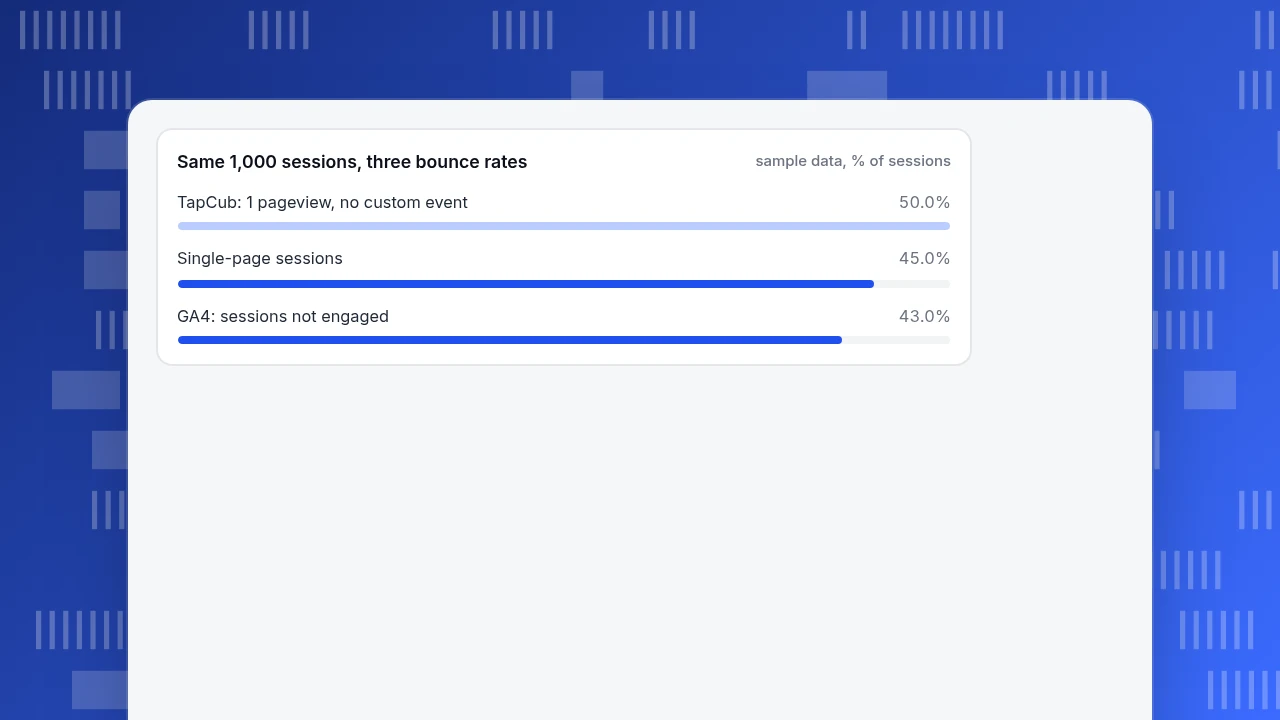
Start freeBounce rate is bounced sessions divided by all sessions, times 100, but what counts as a bounce depends on the tool. On the same 1,000 sessions, a single-page rule gives 45.0%, Google Analytics 4's not-engaged rule gives 43.0% and TapCub's one-pageview, no-custom-event rule gives 50.0%. Check the definition before comparing any two numbers.
What you will learn
- Bounce rate = bounced sessions ÷ sessions × 100; only the meaning of 'bounced' changes between tools
- On 1,000 sample sessions three definitions give 45.0%, 43.0% and 50.0%: a seven-point spread with no tracking error
- Compare each number with its own history, and check duration and goal conversions before editing a high-bounce page
The one formula behind every bounce rate
Every tool that reports a bounce rate uses the same shape:
Bounce rate = bounced sessions ÷ all sessions × 100
The numerator is the part that changes. Three definitions are in common use, and a bounce means something different in each:
| Definition | A session bounces when… | Formula |
|---|---|---|
| Single-page (Universal Analytics, now retired) | It was a single-page session: one request, nothing else sent | single-page sessions ÷ sessions |
| Not engaged (Google Analytics 4) | It was not engaged: no key event, no second page or screen view, and not longer than 10 seconds | (sessions − engaged sessions) ÷ sessions, which is 1 − engagement rate |
| One pageview, no custom event (TapCub) | It had one pageview and no custom event | bounced sessions ÷ sessions |
Google's own help pages give the first two: the Universal Analytics page defines bounce rate as "single-page sessions divided by all sessions", and the Google Analytics 4 page says "the bounce rate is the percentage of sessions that were not engaged". The third is from TapCub's web metric definitions, where a custom event is one whose name does not start with a double underscore.
This guide takes one set of 1,000 sessions and computes all three, so you can see why two dashboards can disagree about the same traffic and which one to trust for which question. If you are deciding whether your number is high or low, read what is a good bounce rate after you have confirmed which definition you are reading.
A worked example: 1,000 sessions, three bounce rates
Sample data: one month of a content site, 1,000 sessions, sorted into seven behaviours. Every session belongs to exactly one group.
| Group | What the visitor did | Sessions |
|---|---|---|
| A | One pageview, nothing else, left in under 10 seconds | 300 |
| B | One pageview, nothing else, but stayed 10 seconds or more (read the article) | 150 |
| C | One pageview, clicked a tab (a custom event, not a key event), left in under 10 seconds | 80 |
| D | One pageview, submitted the newsletter form (a key event), left in under 10 seconds | 40 |
| E | One pageview, played a video (a custom event), stayed 10 seconds or more | 30 |
| F | Two or more pageviews | 350 |
| G | One pageview, followed an outbound link (an automatic __outbound event), left in under 10 seconds | 50 |
| Total | 1,000 |
Single-page definition. A session is single-page when it sent nothing after the first page. That is A and B: 300 + 150 = 450 sessions. 450 ÷ 1,000 = 45.0%. Note that B read for a long time and still counts, because duration is not part of this definition. Google's page also explains the consequence for time: a single-page session has a duration of 0 seconds, because there is no second hit to measure against.
Not-engaged definition. A session is engaged if it has a key event, has two or more page views, or lasts longer than 10 seconds. Engaged groups: B (150), D (40, key event), E (30, longer than 10 seconds), F (350). 150 + 40 + 30 + 350 = 570 engaged sessions, an engagement rate of 57.0%. Bounce rate = 1 − 0.570 = 43.0%, which is A + C + G = 300 + 80 + 50 = 430 sessions. The click in C and the outbound click in G did not rescue those sessions because neither is a key event and neither lasted past 10 seconds.
One pageview and no custom event (TapCub). A bounce is one pageview and no custom event. Group A and B have no event: 450. Group G has only the automatic __outbound event, which the definition ignores, so it still bounces: 450 + 50 = 500 sessions, 50.0%. C, D and E each have a custom event, so they are not bounces. TapCub reports its engaged rate separately: at least 10 seconds, or at least two pageviews, or a key-event goal. That gives B + D + E + F = 570 sessions, 57.0%.
| Measure | Sessions | Rate |
|---|---|---|
| Single-page bounce rate | 450 | 45.0% |
| GA4 bounce rate (not engaged) | 430 | 43.0% |
| TapCub bounce rate | 500 | 50.0% |
| TapCub engaged rate | 570 | 57.0% |
Same traffic, a seven-point spread between the three bounce rates. Nobody miscounted; the definitions answer different questions.
Same 1,000 sessions, three bounce rates
sample data, % of sessionsWhy GA4 can be lower than the old number
Group B is the cleanest explanation. Someone who lands on a long article, reads it for four minutes and leaves is a bounce under the single-page rule and an engaged session under the GA4 rule. Content sites, documentation and blog posts are full of these visits, so a switch to the not-engaged definition usually lowers the bounce rate on such pages. A page where visitors typically leave in under 10 seconds with nothing else tracked sees little change.
Three groups explain most of the gap between definitions:
- Long single-page reads (B): bounce under single-page, engaged under GA4 and TapCub's engaged rate.
- Short visits with an interaction (C): not a bounce under single-page or TapCub's rule, but not engaged under GA4 unless the event is marked as a key event.
- Automatic events (G): not a bounce under a "no further request" rule, but a bounce under TapCub's rule, which ignores
__events, and under GA4 if the visit was short.
If you compare a GA4 figure with a number from a retired Universal Analytics property, expect a different result even if behaviour has not changed. When two numbers are on different definitions, compare each against its own history, not against each other.
| Group (sessions) | Single-page | GA4 not engaged | TapCub bounce |
|---|---|---|---|
| A: 1 page, nothing else, under 10 s (300) | Bounce | Bounce | Bounce |
| B: 1 page, read 10 s or more (150) | Bounce | Engaged | Bounce |
| C: 1 page, custom event, under 10 s (80) | Not a bounce | Bounce | Not a bounce |
| D: 1 page, key event, under 10 s (40) | Not a bounce | Engaged | Not a bounce |
| E: 1 page, custom event, 10 s or more (30) | Not a bounce | Engaged | Not a bounce |
| F: 2 or more pages (350) | Not a bounce | Engaged | Not a bounce |
| G: 1 page, automatic outbound click, under 10 s (50) | Not a bounce | Bounce | Bounce |
| Bounce rate on 1,000 sessions | 45.0% | 43.0% | 50.0% |
Sample data. Single-page counts sessions that sent nothing after the first page; GA4 counts sessions with no key event, fewer than 2 views and 10 seconds or less; TapCub counts one pageview and no custom event.
How to calculate your own from raw sessions
You can reproduce any of these from a session export in a spreadsheet. Use one row per session with four columns: pageviews, custom events, whether a key event fired, and duration in seconds.
- Count sessions. Remove bots first, or the denominator is inflated. In the example, 1,000.
- Choose the definition and write it as a filter. Single-page: pageviews = 1 and events = 0. GA4-style: key event = 0 and pageviews < 2 and duration ≤ 10. TapCub-style: pageviews = 1 and custom events = 0.
- Count the rows that pass the filter. 450, 430 or 500 in the example.
- Divide by sessions and multiply by 100. 45.0%, 43.0% or 50.0%.
- Check the complement. For the GA4 definition, bounce rate plus engagement rate must equal 100%: 43.0% + 57.0%. For TapCub, they do not have to add up to 100%, because bounce depends on custom events and engagement depends on duration, pages and key events. In the example, the 80 sessions of group C are neither bounced nor engaged, and the 150 sessions of group B are both. Check: 500 + 570 − 150 = 920, and 1,000 − 920 = 80.
A quick sanity check on a total row: when you average bounce rates from several days or pages, do not average the percentages. Add the bounced sessions and the sessions separately, then divide. A page with 10 sessions at 100% and a page with 990 sessions at 40% bounce at 40.6% together, not 70%: (10 + 396) ÷ 1,000.
What changes a bounce rate without changing visitor behaviour
Before reading a movement as a trend, rule out the measurement causes:
- Bot traffic. Crawlers usually load one page and leave, which pushes bounce up. TapCub counts known bots on their own report so they do not enter the denominator; with other tools, filter them yourself.
- Single-page apps. If route changes are not recorded as pageviews, every session looks like one page. TapCub counts route changes in a single-page app as pageviews.
- Tracking that sends events automatically. One new event firing on every page load turns every single-page visit into a non-bounce under an event-based rule. Check when a tag changed before blaming content.
- Session rules. Idle timeouts and midnight splits change how many sessions there are. TapCub's default is 30 minutes idle and 24 hours maximum.
- A changed engagement threshold. GA4's 10 seconds is a default; any change moves the number for all history that follows.
If the rate changes on one day across all pages, suspect tracking. If it changes on one page only, suspect that page.
How to use the definitions when you decide something
Pick the question first:
| If you are asking… | Use | Because |
|---|---|---|
| Did visitors do anything at all on arrival? | One pageview, no custom event | It separates silent single-page visits from ones with any tracked action |
| Did visitors give the page real attention? | Engaged rate or not-engaged definition | A four-minute read counts as engagement |
| Is a landing page failing its one job? | Goal conversion rate, with bounce as a clue | A bounce is not a failure when the page is a one-screen answer |
A page that answers a question completely, such as an opening-hours page, can show a high single-page bounce and a happy visitor. That is why the page-level decision rule is: when bounce is high, look at duration and goal conversions on the same page before editing anything. High bounce with long duration is a visitor who got what they came for; high bounce with short duration and no conversion is the case that needs work. Bounce rate versus exit rate covers the other half of that comparison.
In TapCub: reading the bounce rate you actually have
Take the 1,000-session example and the question "is half of our visitors leaving at once?"
- Open the report. Go to Web analytics › Overview for the bounce rate and average duration cards, or Web analytics › Reports for the data report where bounce rate and engaged rate sit side by side.
- Confirm the definition. TapCub's bounce is one pageview and no custom event. Its engaged rate is a separate metric: at least 10 seconds, or at least two pageviews, or a hit on an event goal marked as a key event. Do not subtract one from 100 to get the other; in the example the two add up to 107%, because the 150 sessions of group B are counted in both.
- Split by source. In Web analytics › Sources, the Channels, Referrers and UTM tabs each show bounce and duration per row. A page bouncing at 50% overall may be 30% for search and 80% for one social post; that points to the post, not the page.
- Check goals on the same rows. Web analytics › Goals shows conversion for the same period. A source with high bounce and good goal conversion is not a problem to solve.
- Look for tracking changes. If the rate moved overnight, check whether you added a custom event on page load; that changes which sessions count as bounces. Bots are on Web analytics › Bots, outside your visitor numbers.
TapCub does not rescore history when you change a definition, and it does not label a bounce rate good or bad; the benchmark question is in the linked guide above.
FAQ
How is bounce rate calculated?
Bounce rate is bounced sessions divided by all sessions, times 100. What counts as bounced depends on the tool: a single-page session in Universal Analytics, a session that was not engaged in Google Analytics 4, or one pageview with no custom event in TapCub. In the 1,000-session sample these gave 45.0%, 43.0% and 50.0%.
Is a 100% bounce rate on a page bad?
Not by itself. A page can answer a question completely, so people leave satisfied, and a 100% bounce rate on a handful of sessions is statistically meaningless. Check the session count first, then duration and goal conversions. A high bounce with long duration is usually a visitor who got the answer.
What is the difference between bounce rate and engagement rate?
In GA4 they are complements: engagement rate is the percentage of engaged sessions and bounce rate is the percentage that were not engaged, so they sum to 100%. In TapCub they are separate metrics with different rules, so they can overlap or leave a gap, as the 150 and 80 sessions in the example show.
Why does my bounce rate differ between two tools?
Because each tool counts a different thing as a bounce, sessions are cut differently, bots may or may not be removed, and tracking may fire different events. Compare each tool against its own history, and reconcile the definition first, then the date range.
Does time on page matter for bounce rate?
It depends on the definition. In the single-page definition, duration is irrelevant and a single-page session has a duration of 0 seconds. In GA4, a session longer than 10 seconds is engaged, so a long read is not a bounce. TapCub's bounce rule ignores time, but its engaged rate uses it.
Sources
- Google Analytics Help. Bounce rate (Universal Analytics) — definition as single-page sessions divided by all sessions, and a duration of 0 seconds for single-page sessions. Checked 2026-11-20.
- Google Analytics Help. About the metrics, Google Analytics 4 — engagement rate, bounce rate as the inverse, and the three engaged-session criteria. Checked 2026-11-20.
- TapCub documentation, Web metric definitions (WEB-19) — bounce rate, engaged rate, session rules and bot handling. Checked against apps/docs on 2026-11-20.
Was this article helpful?
We use your answers to fix and expand this page.
Couldn’t send. Please try again in a minute.
Thanks for the feedback. We’ll use it to improve this page.You’ve already sent feedback on this page. Thanks.

Data Analyst
Explores traffic sources, conversion funnels, and retention, using clear metric definitions and concrete examples to explain what the numbers mean.