Try it on your own data
Every report in this article is in the free plan. One snippet for web and apps, up to 10 sites.
Start freeWebsite traffic analysis means reading visits in three passes instead of one total: split traffic by source, judge each source by engagement and conversion, then compare with the previous period to see what moved. A total that grows can hide a channel that brings visitors but almost no results, as the sample below shows.
What you will learn
- Split by source first; a total mixes visits that behave very differently
- Judge each channel by its conversion rate relative to the overall rate, not by its session count
- Break every period-over-period change down by channel before you report it
What does website traffic analysis actually answer?
A traffic total answers one question: how many visits did we get? Website traffic analysis answers three better ones, in a fixed order:
| Pass | Question | What to read | Decision it supports |
|---|---|---|---|
| 1. Source | Where do the visits come from? | Sessions by channel, referrer and campaign | Which channels to feed or fix |
| 2. Quality | Do those visits do anything? | Engaged rate and conversion rate per source | Which sources deserve more effort |
| 3. Change | What moved since the last period? | Per-source change in sessions and conversions | What to investigate this week |
The order matters because a total is a sum of different kinds of visits. A newsletter click, a search click and a stray social click all add 1 to the same number, but they behave very differently afterwards. If you look at the total first, a rise feels like good news and a fall feels like bad news, and neither tells you what to do. Splitting first, judging second and comparing third turns the same numbers into a short list of actions.
This guide walks through the three passes on one set of sample numbers so you can recompute every figure. If you only need to know where to find your traffic numbers, start with how to check website traffic; for what the typical numbers look like, see website traffic statistics.
Pass 1: split traffic by source before anything else
Every session is assigned to a channel by simple rules: campaign tags on the link (UTM parameters), the page the visitor came from (the referrer), and ad click identifiers. The usual channels are organic search, direct, referral, social, email and paid.
Two details decide whether your split is trustworthy:
- Direct means "no source information", not "typed the address". A visit lands in direct when there is no campaign tag and no referrer. Links in emails, PDFs, chat apps and some apps strip or never send a referrer, so untagged links quietly inflate direct and shrink email and social.
- Referrer data is partial by design. Browsers can cut the referrer down to the origin or remove it entirely, which is why a clean split needs tags on the links you control.
The fix is boring and effective: tag every link you place yourself with utm_source, utm_medium and utm_campaign, keep the values lowercase and consistent (newsletter, not Newsletter one week and news-letter the next), and never tag links between pages of your own site, because that overwrites the real source.
A quick sanity rule: if you send a newsletter or run a social post and direct traffic jumps at the same hour, your tags are missing. More on how the channels are defined is in traffic sources types.
Pass 2: judge each source by quality, not volume
Sample data: a small online store, 30 days, five channels. "Engaged" means a session lasted at least 10 seconds or viewed at least 2 pages; the conversion rate is conversions ÷ sessions.
| Channel | Sessions | Engaged sessions | Engaged rate | Conversions | Conversion rate |
|---|---|---|---|---|---|
| Organic search | 5,000 | 3,000 | 60.0% | 100 | 2.00% |
| Direct | 2,500 | 1,500 | 60.0% | 75 | 3.00% |
| Social | 3,000 | 900 | 30.0% | 15 | 0.50% |
| 800 | 640 | 80.0% | 40 | 5.00% | |
| Referral | 700 | 420 | 60.0% | 14 | 2.00% |
| Total | 12,000 | 6,460 | 53.8% | 244 | 2.03% |
The total conversion rate is 244 ÷ 12,000 = 2.03%. Now compare each channel's share of sessions with its share of conversions:
- Social sends 3,000 ÷ 12,000 = 25.0% of sessions but only 15 ÷ 244 = 6.1% of conversions.
- Email sends 800 ÷ 12,000 = 6.7% of sessions and 40 ÷ 244 = 16.4% of conversions.
- Direct sends 20.8% of sessions and 30.7% of conversions.
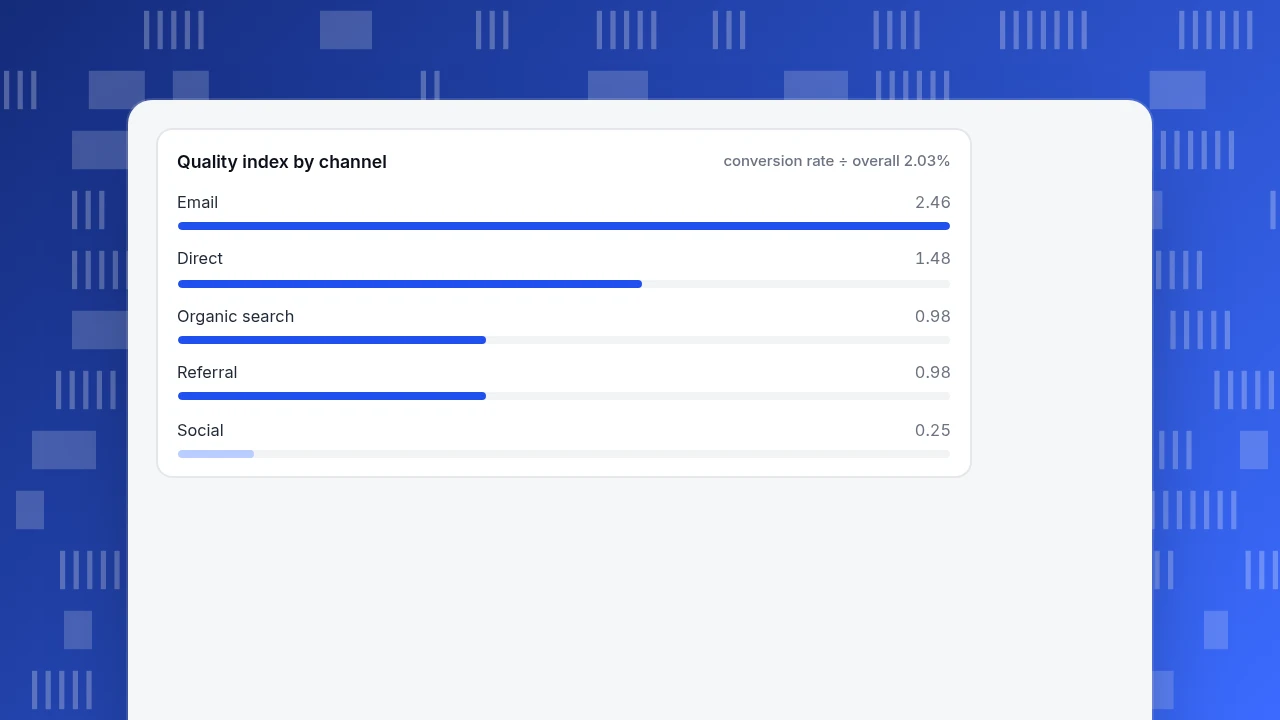
A single number summarises this: the quality index, a channel's conversion rate divided by the overall rate. Social is 0.50% ÷ 2.03% = 0.25, email is 5.00% ÷ 2.03% = 2.46, direct is 1.48, search and referral are 0.98.
Use it as a judgment rule, not a law:
- Index below 0.5: check whether the landing page matches what the link promised before you cut the channel. Mismatch, not the channel, is the usual cause.
- Index above 1.5: the channel converts well, but check its size first. Email has 40 conversions behind it, so doubling the send is a test, not a forecast.
- Fewer than about 30 conversions behind a rate: treat it as a rough signal. One order moves a small channel's rate by several tenths of a point.
Quality index by channel
conversion rate ÷ overall 2.03%Pass 3: compare periods and find what moved
Sessions grew from 10,000 to 12,000, up 20%. That sounds like a win. Break the change down by channel:
| Channel | Sessions before | Sessions now | Change | Conversions before | Conversions now | Change |
|---|---|---|---|---|---|---|
| Organic search | 4,600 | 5,000 | +400 | 92 | 100 | +8 |
| Direct | 2,400 | 2,500 | +100 | 72 | 75 | +3 |
| Social | 1,500 | 3,000 | +1,500 | 12 | 15 | +3 |
| 800 | 800 | 0 | 40 | 40 | 0 | |
| Referral | 700 | 700 | 0 | 14 | 14 | 0 |
| Total | 10,000 | 12,000 | +2,000 | 230 | 244 | +14 |
Three readings come out of this table that the totals hide:
- Social supplied 1,500 of the 2,000 extra sessions (75%) but only 3 of the 14 extra conversions (21.4%).
- The conversion rate fell from 230 ÷ 10,000 = 2.30% to 244 ÷ 12,000 = 2.03%, even though conversions rose 6.1%. The mix shifted towards a weak source.
- The new social visitors converted at 0.2%: 3 extra conversions ÷ 1,500 extra sessions. The old social audience converted at 0.8% (12 ÷ 1,500), so the added reach is colder than the existing one.
The action that follows is specific: look at the social posts that ran this period, see where they landed, and test a landing page that matches the post. Growing search by 400 sessions produced 8 conversions, a better use of attention than the headline suggests.
Two housekeeping rules keep comparisons honest. Compare equal-length periods that start on the same weekday, because weekday patterns are strong. And do not compare a partial period with a full one; if today is included, compare against yesterday up to the same hour.
| Pass | Question | What to read |
|---|---|---|
| 1. Source | Where do the visits come from? | Sessions by channel, referrer, campaign |
| 2. Quality | Do those visits do anything? | Engaged rate and conversion rate per source |
| 3. Change | What moved since last period? | Per-source change in sessions and conversions |
Run the passes in this order; the total comes last.
Separate people from machines and from your own team
Before you trust any pass, check that the visits are real people who are not on your payroll. Automated traffic and internal traffic both distort source and quality tables, usually in the same direction: more sessions, fewer conversions.
| Symptom in the data | Likely cause | What to check |
|---|---|---|
| Sudden spike, near-total bounce, one country, one page | Automated traffic | Is the spike a single country and a single landing page? Compare to the bot report |
| Direct jumps the hour an email or post goes out | Missing campaign tags | Open the link you sent and look for utm parameters |
| Sessions that never click anything, at office hours | Internal traffic | Exclude your office and team addresses |
| One day drops to zero | Tracking gap or outage | Compare the day with server logs or the error report |
| Steady growth from one unfamiliar referrer | Referral spam or a real mention | Open the referring page before you celebrate |
The rule is to filter first and analyse second. A spike you cannot explain gets investigated before it gets reported; traffic spike covers the common causes in more detail. For setting up the exclusions, see exclude internal traffic and bots and AI crawlers.
A weekly traffic review in five steps
The three passes fit in a 15-minute weekly routine:
- Set the window. Last 7 days against the previous 7 days, both complete.
- Read the channel table. Note any channel whose sessions changed by more than 20% or whose share moved by more than 5 points.
- Check quality. For each moving channel, compare the engaged rate and conversion rate with the overall rate (the quality index).
- Find the biggest mover. Which one channel explains most of the change, in sessions and in conversions?
- Write one sentence and one action. For the sample above: "Social added 75% of new sessions at a 0.2% marginal conversion rate; next week we test a landing page that matches the post."
The one-sentence summary is the point. If you cannot write it, you have a report, not an analysis. Save the sentence next to the chart so the next review can check whether the action worked.
Common mistakes in traffic analysis
- Reading the total first. In the example, the total said +20% and hid a falling conversion rate.
- Ranking channels by sessions. Social was second by sessions (25%) and fourth by conversion rate (0.50%).
- Comparing rates built on different bases. A rate of conversions ÷ sessions and a rate of converting people ÷ people are different numbers; do not set them against each other.
- Tagging internal links. UTM tags on links between your own pages restart the session's source and credit your own site.
- Acting on tiny channels. Fourteen conversions behind a rate is a hint, not a result.
- Reporting a spike you have not explained. Bots, tests and tracking changes all look like growth.
How to run the three passes in TapCub
Take the store above. Here is how it would read its own numbers in TapCub web analytics; the interpretation and the landing page test stay with you.
- Set the window. In Web analytics › Overview, pick the last 30 days and turn on comparison with the previous period. The same dates and comparison apply to every web report you open next.
- Split by source. Open Web analytics › Sources. The Channels tab lists each channel with visitors, sessions, pageviews, bounce, duration and conversions. By default each session is credited to the source it arrived from; switch the counting to every arrival only if you want to see mid-session external arrivals too.
- Check your tags. The UTM tab splits traffic by source, medium, campaign, term and content. If a campaign you ran shows up under direct, the link was untagged.
- Judge quality. Click a channel row to filter the other reports by it, then read the bounce rate and the conversion count against your goals in Web analytics › Goals. Note that the goal rate counts people divided by people, while the report conversion rate counts conversions divided by sessions; keep to one when comparing.
- Keep the data clean. Recognised bots are counted separately in Web analytics › Bots and are not added to visitors or conversion rates, and you can exclude your own team's traffic in settings.
Two boundaries: TapCub shows you the split and the change, but it does not tell you why social visitors are colder, and it does not run the landing page test. It only measures what happens after.
FAQ
What is website traffic analysis?
Website traffic analysis is reviewing visits to a site in three passes: where they come from (source), whether they do anything useful (quality), and what changed since the previous period (change). It turns a single visit total into decisions about which channels and pages to improve.
What metrics should I look at first?
Start with sessions by channel, then engaged rate and conversion rate for each channel, then the change versus the previous period. Add pages and landing pages once you know which channel needs attention. Visit totals and pageviews alone cannot tell you whether traffic is useful.
How often should I analyse website traffic?
A short weekly review of complete weeks, plus a deeper monthly one, is enough for most sites. Check daily only when you run a campaign, release a change or have an alert fire. Daily numbers are noisy, and reacting to them often makes the picture worse.
Why did traffic go up but conversions did not?
Usually the mix changed: a low-converting source supplied most of the growth. In the sample above, social supplied 75% of the extra sessions but 21.4% of the extra conversions, so the overall conversion rate fell from 2.30% to 2.03%. Split by source to confirm.
How can I tell if a traffic spike is real?
Check whether it comes from one country, one page or one source, whether sessions are near-zero length, and whether it matches something you did, such as a campaign or a mention. If none applies, treat it as automated traffic until you can explain it.
See also: Website Traffic Analysis Tools: What Each Type Answers.
Sources
- Google. Engagement rate and bounce rate (Analytics Help) — the 10 seconds / 2 pageviews engaged-session definition used in the sample. Verified 2026-11-19.
- Google. Collect campaign data with custom URLs (Analytics Help) — the UTM parameters and why consistent values matter. Verified 2026-11-19.
- MDN Web Docs. Referer header and Referrer-Policy — how browsers send or limit the referrer. Verified 2026-11-19.
Was this article helpful?
We use your answers to fix and expand this page.
Couldn’t send. Please try again in a minute.
Thanks for the feedback. We’ll use it to improve this page.You’ve already sent feedback on this page. Thanks.

Data Analyst
Explores traffic sources, conversion funnels, and retention, using clear metric definitions and concrete examples to explain what the numbers mean.