Try it on your own data
Every report in this article is in the free plan. One snippet for web and apps, up to 10 sites.
Start freeWebsite optimization tools are best chosen by the question they answer, because the label covers five different jobs: where traffic comes from, whether pages are slow, where people give up, whether a change worked, and whether search engines can reach the site. No single tool answers all five. Work down them in order; an experiment platform comes last, not first.
What you will learn
- Name the question first: traffic, speed, drop-off, did it work, search discovery; each needs a different kind of tool
- Use a funnel to find the step before a heatmap; in the sample the same 5 points gain 90 purchases at the cart step and 22.5 at the weakest other step
- Do not start with an experiment tool: detecting 2.7% to 3.2% needs about 36,000 sessions, so small sites should use a careful before-and-after check
Which question is each website optimization tool really answering?
"Website optimization tools" covers products that have almost nothing in common: a speed tester, a heatmap, an experiment platform, a rank tracker. Buying by the label gives you a pile of dashboards and no decisions. Buy by the question instead. Optimization work comes down to five questions, and each one needs a different kind of tool.
| Question | Kind of tool | What it gives you | What it cannot tell you |
|---|---|---|---|
| Where do visitors come from? | Web analytics with sources and campaign tags | Visitors and conversions by channel, source and campaign | Why a channel converts badly |
| Is the page slow? | Real-user performance monitoring, plus lab speed tests | Load and interaction timings by page, device and country | Whether slowness costs you sales |
| Where do people give up? | Funnels, heatmaps, session replay | The step with the biggest loss, and how people behave on it | Whether a fix will work |
| Did my change work? | Experiment tools, or a careful before-and-after comparison | A measured difference with an uncertainty range | What to test next |
| Can search engines find and crawl it? | Search console data and crawl reports | Impressions, clicks, rankings, crawl errors | How visitors behave once they arrive |
Notice that no single tool answers all five. A common mistake is to buy the tool for the question you find most interesting (usually "did it work?") before you can answer the first three. Work down the table in order: you cannot judge whether a change helped until you know where traffic comes from, whether pages are fast enough, and where people leave. The methods behind this are in website optimization; this article is about choosing tools for each step.
Where is the traffic coming from?
Start here, because every other number depends on it. A conversion rate averaged over all channels hides the fact that paid social, email and organic search behave differently. You need visitors, conversions and conversion rate by channel and campaign.
What to look for in a tool for this question:
- Source and campaign breakdown. Channel, source and campaign tags (such as UTM parameters) in one table.
- Real people separated from bots. Crawlers inflate the denominator and make every rate look worse.
- Goals tied to the same visitors. The number of conversions must come from the same data as the number of visitors, or the rate means nothing.
- A way to compare periods. Last week against the week before, same weekday.
Decision rule: if you cannot say which three sources send the most visitors and which convert best, do not buy anything else yet. If you can, the next question is whether the pages they land on are fast. For the audit step that checks the data itself, see web analytics audit.
Is the page slow, and does it matter?
There are two kinds of speed tool, and they answer different questions.
- Lab tests load a page in a controlled setting. They are repeatable and good for debugging, but they use one device and one network.
- Real-user (field) monitoring measures the loads that visitors actually experience, on their devices and networks. It is noisier and slower to react, but it is the truth about your audience.
Google's Core Web Vitals use field data. The good thresholds are 2.5 seconds or less for largest contentful paint, 200 milliseconds or less for interaction to next paint, and 0.1 or less for cumulative layout shift, assessed at the 75th percentile of page loads, segmented by mobile and desktop. A page passes when all three meet their targets at that percentile.
Three rules for using speed tools:
- Pick problems from field data, debug them in the lab. Field data tells you which pages and devices are slow; a lab run tells you why.
- Look at the 75th percentile, not the average. The average hides the slow quarter of visits.
- Check whether slow pages also lose people. A slow page nobody visits matters less than a slightly slow checkout. Put the slow-page list next to the drop-off list.
A page with a big loss and slow loading is a fix with a clear owner. A slow page with no loss can wait. More on this in web performance monitoring.
Where do people give up?
This question needs two kinds of tool that work as a pair. A funnel tells you which step loses the most visitors. A heatmap or session replay shows what people did on that step. Use them in that order: a funnel first, then the page behind the worst step.
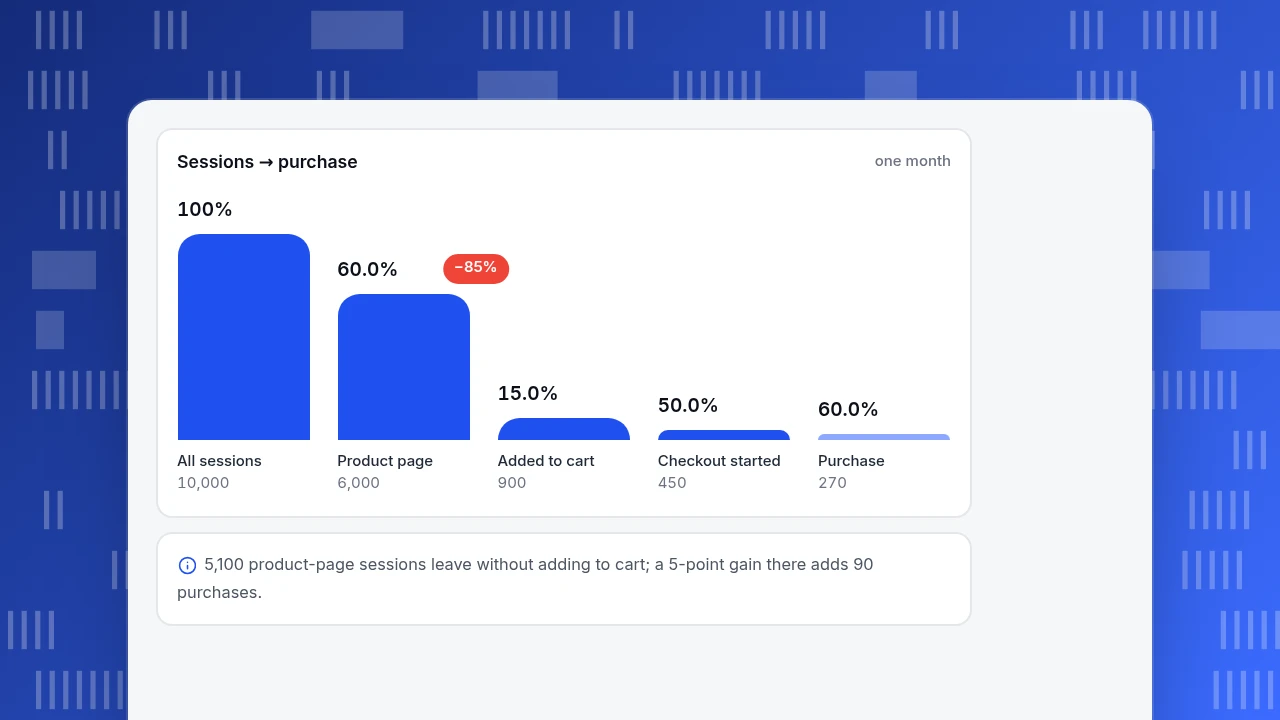
Sample data: a store's month of sessions, step by step.
| Step | Sessions | Rate from the previous step |
|---|---|---|
| All sessions | 10,000 | n/a |
| Product page | 6,000 | 60.0% |
| Added to cart | 900 | 15.0% |
| Checkout started | 450 | 50.0% |
| Purchase | 270 | 60.0% |
Overall conversion is 270 ÷ 10,000 = 2.7%. The largest relative loss is at the cart step: only 15.0% of product-page sessions add to cart, so 5,100 sessions leave there.
Which step is worth working on? Suppose each step could improve by the same 5 percentage points:
- Product page, 60% to 65%: 6,500 × 15% × 50% × 60% = 292.5 purchases, a gain of 22.5.
- Added to cart, 15% to 20%: 6,000 × 20% × 50% × 60% = 360 purchases, a gain of 90.
- Checkout started, 50% to 55%: 900 × 55% × 60% = 297 purchases, a gain of 27.
- Purchase, 60% to 65%: 450 × 65% = 292.5 purchases, a gain of 22.5.
The same five points are worth four times more at the cart step than anywhere else. The funnel finds the step; a heatmap or replay of the product page then shows whether people miss the button, scroll past it or get distracted. For funnel methods, see conversion funnel optimization, and for what the colours on a heatmap do and do not show, see heatmap.
Two cautions. A heatmap shows behaviour in aggregate and cannot say why. And session replay records real sessions, so check what your privacy settings mask before you turn it on.
Did the change actually work?
This is the hardest question and the one tools claim to answer most confidently. There are two honest ways to answer it.
A controlled experiment splits visitors at random between the old and new versions and compares them over the same period. It is the strongest evidence, but it needs enough traffic. For the sample store above, with a 2.7% purchase rate, detecting a lift to 3.2% (half a percentage point) at a 5% significance level and 80% power needs about 17,976 sessions per version, or roughly 36,000 sessions in total. At 10,000 sessions a month, all of them in the test, that is about 3.6 months. Detecting a smaller lift of 0.3 points needs about 48,292 per version. The numbers come from the standard two-proportion sample-size formula; calculators such as Evan Miller's use the same inputs: baseline rate, minimum detectable effect, power and significance.
Two rules protect an experiment: decide the sample size before you start, and do not stop when the result first looks significant. Checking repeatedly and stopping early inflates false positives; Evan Miller's example shows a nominal 5% test giving a false positive 26.1% of the time when checked after every observation and the change did nothing.
A before-and-after comparison is what small sites can do. It is weaker because anything else that changed (a campaign, a holiday, a competitor, a release) is mixed in. To make it more honest:
- Mark the change date. Annotate the chart with the release or campaign so others can see what else happened.
- Compare the same period length and weekday mix. Two full weeks before against two full weeks after.
- Check a metric the change should not affect. If traffic from a channel the change cannot touch moved the same way, suspect the season, not the change.
- Treat small differences as unknown. If the gap is within normal week-to-week variation, you have no evidence either way.
If you lack the traffic for an experiment, say so in the report rather than pretending a before-and-after is proof.
Can search engines and crawlers reach the site?
The last question is about discovery. Search consoles report impressions, clicks, average position and crawl errors by page and query, usually a day or three late. Use them to find pages that rank on page one but get few clicks (the title and description may be weak) and pages with crawl errors. This is the only kind in the table that sees impressions that never turned into visits, which is why it complements analytics rather than replacing it. Keyword research and backlink tools are a separate category, built for a different job, and are not covered here.
What is the smallest set of tools that works?
Do not start with all five. Start with the questions you cannot yet answer, in table order.
| Stage | What you can already answer | Add next | Why |
|---|---|---|---|
| New site | Nothing | Web analytics with sources and goals | Everything else needs it |
| Traffic known | Where visitors come from | Real-user performance monitoring | Slow pages cost conversions quietly |
| Speed known | Which pages are slow | A funnel on the main path | Finds the step to fix |
| Step found | Where people leave | Heatmap or replay on that page | Shows what they do there |
| Fix shipped | Whether a change should help | A before-and-after check, or an experiment if traffic allows | Proves it |
| Established | Everything above | Search console data | Catches discovery problems |
A small site can run the first four rows with one analytics tool. An experiment platform is the last purchase, not the first.
Common mistakes when picking optimization tools
- Buying by category label. "Optimization" is five jobs; name the question first.
- Starting with the experiment tool. Without traffic, funnels and speed data you do not know what to test.
- Trusting a lab speed score over field data. The lab uses one device; your audience uses thousands.
- Reading a heatmap as an explanation. It shows where people click, not why.
- Stopping a test early. A result that first looks significant often is not.
- Reading an average. Averages hide the slow quarter of visits and the channel that behaves differently.
- Tool overlap. Three tools that all count visitors will give three numbers; pick one source of truth.
How to cover these questions in TapCub
Take the sample store: you want more purchases. TapCub covers most of the first four questions in one place, and is not an experiment or SEO research tool.
- Find the channels. In Web analytics › Sources, read visitors and conversions by channel, source and UTM parameters. Bots and AI crawlers are counted separately, so they do not distort the rates. Check goals in Web analytics › Goals.
- Check speed. Monitoring › Performance reports real-user timings: five metrics, a 0 to 100 score, P75 and other percentiles, a breakdown by page, country, device, browser and operating system, and a list of slowest pages sorted by P75 largest contentful paint. It has no previous-period comparison, and it is empty if the script does not collect the metrics.
- Find the losing step. In All-platform analytics › Behavior › Behavior analysis, build the funnel from the sample table and read the step rates. Then open All-platform analytics › Behavior › Heatmaps for the product page, and Session replay (off by default) if you need to watch sessions.
- Track the change. Mark the release or campaign in Configuration › Annotations so the line shows on trend charts, and use the header's period comparison to line up the weeks. TapCub does not split traffic or run A/B experiments; it only measures, so run any experiment elsewhere and read the result in TapCub.
- Watch search. If you connect Google Search Console or Bing Webmaster, Monitoring › Search performance shows clicks, impressions and average position by page and query, usually one to three days late, and flags pages ranked in the top 10 with a click-through rate below the median.
TapCub does not do keyword research, backlink analysis or rank tracking beyond what the search console reports. For funnel and heatmap how-to, see how to read a heatmap.
FAQ
What are website optimization tools?
They are tools that help you improve a site's traffic, speed, conversion or search visibility. The label covers five different jobs: finding where traffic comes from, measuring page speed, finding where people leave, testing whether a change worked, and checking that search engines can reach the site. Pick by question, not by category.
Which website optimization tool should I start with?
Start with web analytics that shows sources and goals, because every other tool needs those numbers to be useful. Add real-user speed monitoring next, then a funnel on your main conversion path. Add heatmaps and experiments only when you know which page and step to improve.
Do I need an A/B testing tool to optimize my site?
Not at first. An experiment needs a lot of sessions: in the sample, about 36,000 to detect a 0.5-point lift on a 2.7% rate. Until you have that traffic, use funnels and speed data to find the biggest problem, then check changes with a careful before-and-after comparison.
What is the difference between lab and field speed data?
Lab data comes from loading a page in a controlled setup, so it is repeatable and good for debugging. Field data measures real visitors on their own devices and networks, so it shows the real experience. Google's Core Web Vitals are assessed on field data at the 75th percentile.
How do I know if a change improved conversion?
Compare against a control if you have the traffic, with the sample size set in advance. If you do not, compare equal-length periods with the same weekday mix, mark the change date, and check a metric the change should not affect. Treat small differences within normal variation as unknown.
Sources
Was this article helpful?
We use your answers to fix and expand this page.
Couldn’t send. Please try again in a minute.
Thanks for the feedback. We’ll use it to improve this page.You’ve already sent feedback on this page. Thanks.

Data Engineer
Writes about event design, data quality, and collection workflows, with verifiable implementation methods for reliable analytics.