Try it on your own data
Every report in this article is in the free plan. One snippet for web and apps, up to 10 sites.
Start freeWebsite monitoring is the continuous checking of a site so you find problems before visitors do, and it splits into four types: availability, performance, errors and content. Each needs its own check and its own alert rule. Below: how synthetic checks and real-user data fit, how interval and confirmation set detection time, and how to set thresholds from history.
What you will learn
- Four types need four kinds of check; one uptime ping is not monitoring
- A 15-minute interval can miss a 10-minute outage entirely and never fire a two-failure alert
- Set thresholds from history and dry-run them: in the sample, the average fired on 6 of 14 days and mean + 3 sd on none
What is website monitoring, and what are its four types?
Website monitoring is the continuous checking of a site so you hear about problems before your visitors tell you. It covers four things: whether the site is available, how fast it is, whether it throws errors, and whether the content is still what it should be. Each type answers a different question and uses a different signal, which is why a single "uptime check" is not monitoring.
| Type | The question | Typical signal | Example failure it catches |
|---|---|---|---|
| Availability | Can people reach the site and does it answer? | Response status, response time to a check, certificate and DNS validity | Server down, expired certificate, DNS misconfiguration |
| Performance | Is it fast enough for real visitors? | Page load and interaction timings, such as Core Web Vitals | A new script that makes pages slow on mobile |
| Errors | Is something failing for some visitors? | Server error responses, script errors, error rate | A release that breaks the checkout button |
| Content | Is the right thing on the page? | A check that expected text or an element is present; robots and indexing tags | A page serving a blank template, an accidental noindex |
Google's engineering book on monitoring distributed systems names four "golden signals" for services: latency, traffic, errors and saturation. Three of them map onto the table directly: latency is performance, errors are errors, and a sudden collapse in traffic is often the first symptom of an availability failure. This guide covers the practical version for a website. For the single term, see monitor.
The thesis of this guide is that the four types need different checks and different alert rules. Mixing them is how teams end up with a flood of pages about slow pages and silence on a broken checkout.
| Type | The question | Typical signal |
|---|---|---|
| Availability | Can people reach the site and does it answer? | Response status, check response time, certificate and DNS validity |
| Performance | Is it fast enough for real visitors? | Page load and interaction timings such as Core Web Vitals |
| Errors | Is something failing for some visitors? | Server error responses, script errors, error rate |
| Content | Is the right thing on the page? | Expected text or element present; robots and indexing tags |
Each type needs its own check and its own alert rule.
How do synthetic checks and real-user data fit together?
There are two ways to collect the signals.
Synthetic monitoring sends scripted requests to your site from outside, on a schedule, whether or not anyone is visiting. It is how you learn about an outage at 3 a.m. with no traffic. It sees what the script sees. See synthetic monitoring.
Real-user monitoring records what actual visitors experienced, in their browsers, on their networks. It sees real devices, real locations and real journeys, but only when someone visits. See real user monitoring.
| Synthetic checks | Real-user data | |
|---|---|---|
| Runs when nobody visits | Yes | No |
| Sees device and network variety | No | Yes |
| Best for | Availability, certificates, key flows | Performance, errors, who is affected |
| Weak spot | One path through the site | Needs traffic; silent if the script cannot load |
Use synthetic checks for the question "is it up?" and real-user data for "how is it for people?". The one hole to watch is a site that is down so completely that the tracking script never loads: real-user data goes quiet, and that silence looks like zero visits. A rule that fires when no data arrives for a set number of minutes covers it.
How often should you check, and how many failures should it take to alert?
Two settings decide how fast you find out: the check interval, and how many consecutive failures you require before alerting. Requiring two failures in a row avoids alerts for a single network hiccup.
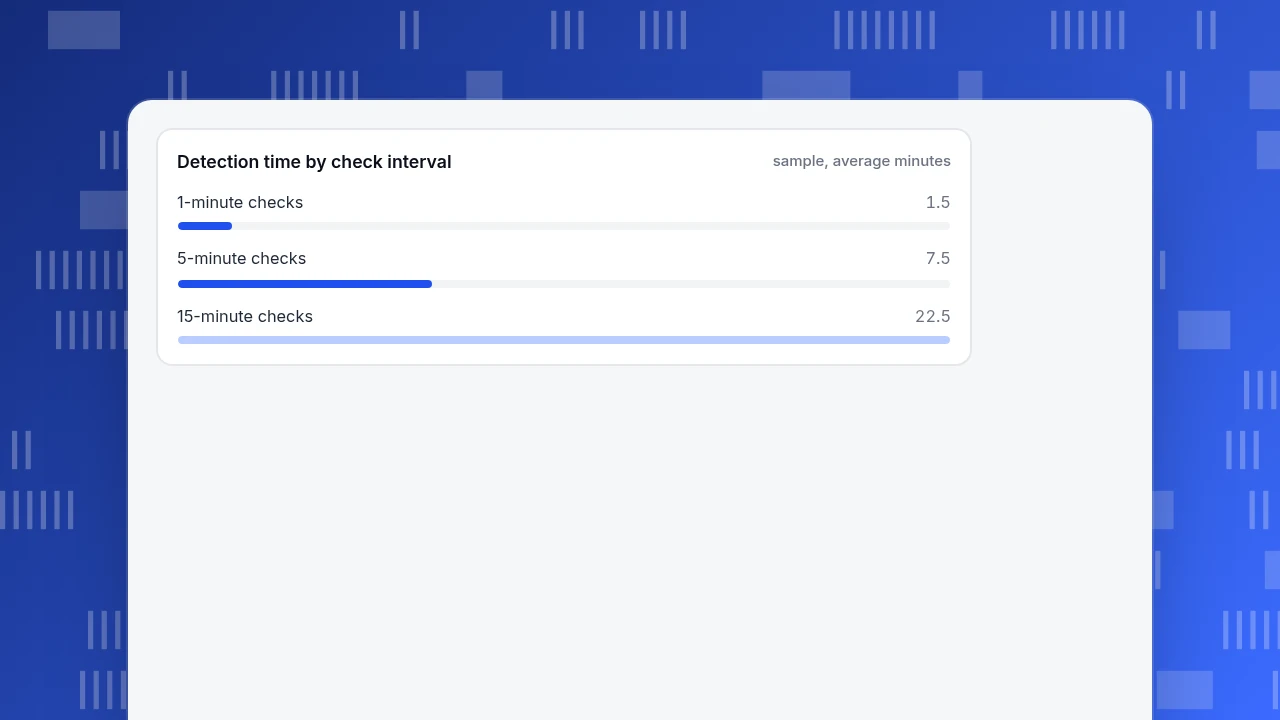
Sample data and arithmetic: with an interval of T minutes and an alert after two consecutive failed checks, the first failed check happens between 0 and T minutes after the outage starts, and the alert fires one interval later. So detection takes between T and 2T minutes, and 1.5T on average.
| Check interval | Detection time (range) | Average | Chance a 10-minute outage fails at least one check | Chance it fails two checks in a row |
|---|---|---|---|---|
| 1 minute | 1 to 2 minutes | 1.5 minutes | 100% | 100% |
| 5 minutes | 5 to 10 minutes | 7.5 minutes | 100% | 100% |
| 15 minutes | 15 to 30 minutes | 22.5 minutes | 66.7% (10 ÷ 15) | 0% |
With 15-minute checks, a 10-minute outage can pass unseen (one check in three misses it) and can never trigger a two-failure alert. Choose the interval from the outage you cannot afford, not from what the tool allows.
How much outage is that? For a 30-day month, 99.9% availability allows 30 × 24 × 60 × 0.001 = 43.2 minutes of downtime, 99.5% allows 216 minutes (3.6 hours), and 99% allows 432 minutes (7.2 hours). If 43.2 minutes is your budget, a 15-minute check interval is already too coarse to tell you whether you are within it.
Detection time by check interval
sample, average minutesWhat should you monitor for performance?
Performance monitoring should answer how real visitors experience the pages, measured the way search engines and browser vendors define it. Google's Web Vitals guidance sets three Core Web Vitals and their "good" thresholds: Largest Contentful Paint within 2.5 seconds, Interaction to Next Paint of 200 milliseconds or less, and Cumulative Layout Shift of 0.1 or less, each measured at the 75th percentile of page loads and segmented across mobile and desktop. It also states that these are first and foremost field metrics; lab tests help during development but do not replace measuring real visits. See also web performance monitoring.
The percentile matters, because averages hide the slow tail. Sample data: 20 page loads with Largest Contentful Paint (seconds) of 1.2, 1.3, 1.4, 1.5, 1.6, 1.7, 1.8, 1.9, 2.0, 2.1, 2.2, 2.3, 2.4, 2.5, 2.6, 2.8, 3.1, 3.6, 4.4 and 5.8.
| Statistic | Value | Against the 2.5 s threshold |
|---|---|---|
| Median | 2.15 s | Good |
| Average | 2.41 s | Looks good |
| 75th percentile | 2.65 s | Needs improvement |
The median and the average both pass, and the 75th percentile fails. A quarter of visitors waited at least 2.65 seconds, which is what the guidance measures. Monitor by page and by device, not only site-wide, because one slow template can hide inside a good average.
What counts as an error worth alerting on?
An error is a request or a page view that did not do what it should. Google's monitoring chapter separates three kinds: explicit errors (such as a server error response), implicit errors (a success response with the wrong content), and errors by policy (a response that was correct but too slow for a promised time). For a site, the sources are:
- Server errors. HTTP status codes in the 5xx range mean the server failed to fulfil a valid request (RFC 9110 defines the class). One 500 is noise; a rising share is a signal. See HTTP 500 error.
- Script errors in the browser. An exception in the page's JavaScript, often after a release, which can break a button without any server error.
- Broken flows. A page that loads but cannot complete its purpose: a checkout that returns to the cart, a form that does nothing.
Track the error rate rather than the count, because traffic changes the count. Error rate is errors ÷ pageviews. Sample data: 80 errors on 20,000 pageviews is 80 ÷ 20,000 = 0.40%. The same 80 errors on 2,000 pageviews would be 4.0%, a very different situation. Definition in error rate.
How do you write alert rules that people do not ignore?
Google's monitoring chapter gives the rules: page on symptoms that users experience, make every page demand a human decision, and move lower-priority issues to dashboards or tickets, because frequent alerts train people to skim and ignore them. Applied to a website:
| Alert | Condition | Goes to | What the person does |
|---|---|---|---|
| Site unreachable | Two failed checks in a row | Phone or chat, immediately | Check the host, restart or roll back |
| Error rate spike | Daily or hourly rate above a threshold set from history | Chat or email | Find the release or the failing page |
| Traffic collapse | Visits far below the same day last week | Chat or email | Check whether tracking or the site broke |
| Slow pages | 75th percentile above the threshold for a page type | Ticket, weekly review | Plan a fix; not an emergency |
| Certificate expiring | 14 days before expiry | Renew |
Set thresholds from your own history, not a guess. Sample data: the daily error rate for 14 days was 0.38, 0.42, 0.40, 0.35, 0.44, 0.41, 0.39, 0.43, 0.37, 0.45, 0.40, 0.36, 0.42 and 0.39 percent. The mean is 0.40% and the standard deviation about 0.03 points. A threshold set at the average (0.40%) would have fired on 6 of the 14 days, which is noise. A threshold of mean plus three standard deviations, about 0.49% and rounded up to 0.50%, would have fired on none of them, but would catch a day at 1.2%. If your tool offers a dry run that shows how often a rule would have fired in the past, use it before turning the rule on.
What mistakes make website monitoring noisy or blind?
- Checking only the home page. The home page can be fine while checkout fails. Check the pages that make money.
- Alerting on a single failure. One failed check is usually network noise; require two.
- Alerting on causes, not symptoms. "CPU at 80%" may mean nothing; "error rate above 1%" always does.
- Using averages for performance. As the example shows, the average passed while a quarter of visitors had a poor experience.
- Treating silence as health. If the tracking script cannot load, real-user data goes quiet. Alert on missing data as well as bad data.
- Never reviewing alerts. Every month, list the rules that fired and what anyone did. Remove or retune those where the answer was nothing.
How to monitor errors, speed and traffic in TapCub
Here is how the error-rate example above works in TapCub, from reading the numbers to getting notified.
- Read the current state. Open Monitoring › Errors. Cards show error count, error rate (errors ÷ pageviews), affected visitors and affected sessions. Each group of errors has a count, sessions involved and last-seen time, and a status of Active, Resolved or Ignored; expand a group to see each occurrence with its page, device and session. Error collection must be switched on in the install snippet.
- Check speed on real visits. Open Monitoring › Performance. The numbers come from real page loads in the visitors' browsers, with the Core Web Vitals thresholds shown above. Cards can switch between P95, P75, median and average, and the page breakdown shows the slowest pages by P75 Largest Contentful Paint.
- Create a monitor. In All-platform analytics › Operations › Monitors, choose the built-in measure
error_rate, a fixed threshold (for example above 0.50%) and a daily grain. Other built-in measures includeerrors,uv,sessions,pv,bounce_rateandavg_duration, and conditions include period change, a forecast band, anomaly and collection gap. - Dry-run it. A dry run calculates only, sends nothing, and reports how many times the last 30 days would have fired, which is the check done by hand in the example above.
- Choose where it goes. Channels are email, WeCom, DingTalk, Feishu and webhook (with a Slack template). By default the same rule does not repeat for about 60 minutes, and three hits in a row pause it. For a silent site, add a collection-gap condition so that no data for a set number of minutes notifies you. Configuration › Settings › Notifications also holds operational alerts for traffic spike, traffic drop, crawl anomaly and error spike.
TapCub monitors the data its own script collects from real visits. It does not run scheduled checks of your site from outside, so it will not replace an uptime or synthetic check, and it does not check page content. A monitor only notifies; it never fixes or rolls anything back. Monitoring › Crawl health adds one more availability signal, showing search engine fetches with their success rate, 404s and 5xx.
FAQ
What is website monitoring?
Website monitoring is the ongoing checking of a site's availability, performance, errors and content so problems are found before visitors report them. It combines scheduled outside checks, called synthetic monitoring, with data from real visits, and it sends an alert when something crosses a threshold.
What should you monitor on a website?
Four things: availability (is it reachable and answering correctly), performance (page speed and interactions for real visitors), errors (server and script errors as a rate of page views) and content (the right text or elements, and no accidental noindex). Start with the pages that earn money, such as checkout and signup.
How often should you check a website?
Pick the interval from the outage you cannot afford. With an alert after two failed checks, detection takes between one and two intervals: 1.5 intervals on average. A 5-minute interval finds a 10-minute outage every time; a 15-minute interval can miss it entirely. Check key pages more often than minor ones.
What is the difference between uptime monitoring and performance monitoring?
Uptime monitoring asks whether the site answers at all, usually through scheduled checks from outside. Performance monitoring asks how fast and smooth it is for real visitors, measured as page-load and interaction timings at a percentile such as the 75th. A site can be up and still too slow.
Is website monitoring the same as web analytics?
No. Web analytics counts and describes visits to understand audiences and results. Monitoring watches the health of the site and alerts you to problems. They share data, such as error counts and page speed from real visits, but they answer different questions.
Sources
- Google. Monitoring Distributed Systems, Site Reliability Engineering. The four golden signals, kinds of error, and rules for alerting on symptoms. Checked 2026-11-19.
- Google. Web Vitals, web.dev. Core Web Vitals thresholds, the 75th percentile and field versus lab data. Checked 2026-11-19.
- IETF. RFC 9110: HTTP Semantics, the 5xx server error status class. Checked 2026-11-19.
Was this article helpful?
We use your answers to fix and expand this page.
Couldn’t send. Please try again in a minute.
Thanks for the feedback. We’ll use it to improve this page.You’ve already sent feedback on this page. Thanks.

Data Analyst
Explores traffic sources, conversion funnels, and retention, using clear metric definitions and concrete examples to explain what the numbers mean.