Try it on your own data
Every report in this article is in the free plan. One snippet for web and apps, up to 10 sites.
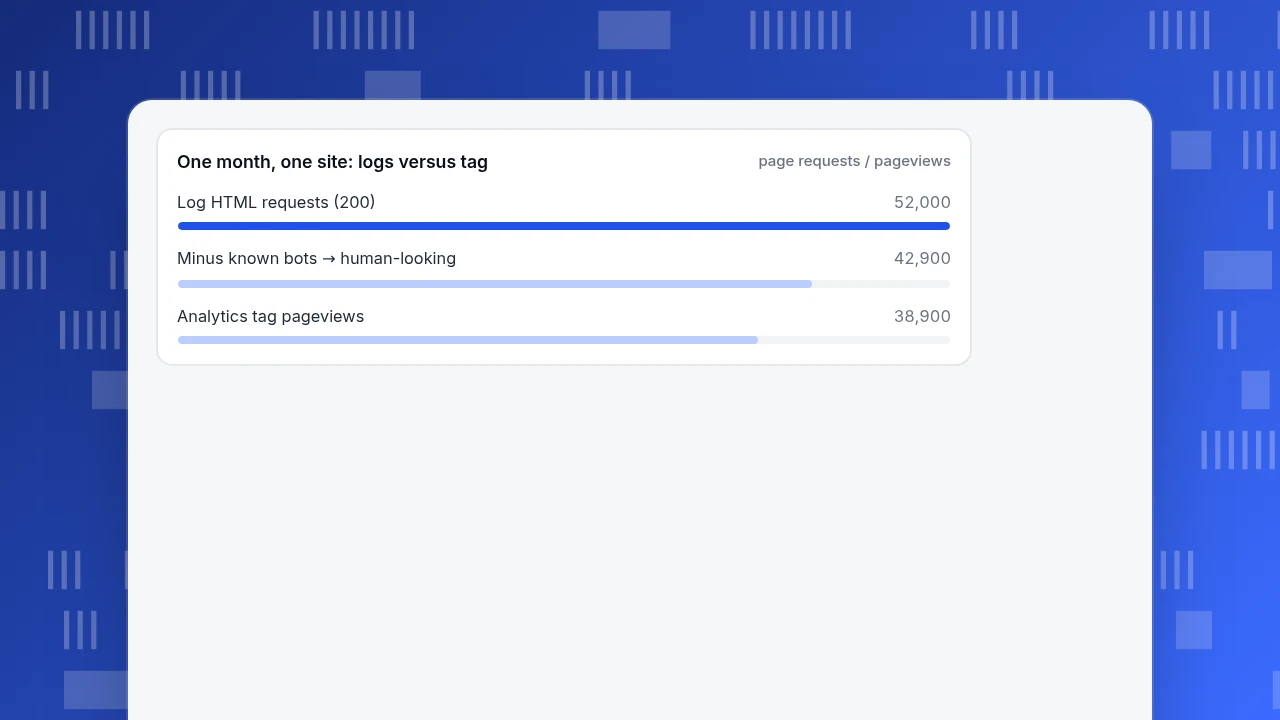
Start freeWebsite traffic analysis tools come in four types, and each counts something different: on-site analytics counts what the browser reports, server logs count every request, search console counts search impressions and clicks, and panel estimators model other sites. Choose the type from the question, then reconcile. In the sample below, 52,000 log requests become 42,900 once known bots are removed, against 38,900 pageviews in the tag.
What you will learn
- Pick the tool type from the question: your own visitors need first-party data, competitors only have estimates
- Reconcile logs, tag and search console on one week before trusting any of them
- Use panel estimates to compare competitors with each other, never in your own reporting
Which kinds of website traffic analysis tool exist?
Website traffic analysis tools fall into four types, and they answer different questions because they count different things: an on-site analytics tag counts visits it can see in the browser, server logs count requests the server received, search console data counts impressions and clicks in search results, and panel-based estimators model traffic for sites they do not own. No type is a better version of another. If two of them disagree, that is usually the point of having both. For the process of reading the numbers once you have a tool, see website traffic analysis; for a long comparison of analytics products, see web analytics tools. This guide is about choosing the type first.
| Type | What it counts | Needs your site code? | Works for competitors? | Typical blind spot |
|---|---|---|---|---|
| On-site analytics (tag or script) | Visits, pages, sources, events and goals seen in the browser | Yes | No | Blocked scripts, declined consent, visitors without JavaScript |
| Server logs | Every request the server handled | No, but needs log access | No | Bots and assets mixed in; no referrer or user agent unless configured |
| Search console data | Impressions, clicks, position for your pages in search | Site verification | No | Search only; some queries are omitted; data lags |
| Panel and modelled estimates | Modelled visits for any domain | No | Yes | Estimates; weak on small sites |
| Type | What it counts | Typical blind spot |
|---|---|---|
| On-site analytics | Visits, sources, events and goals seen in the browser | Blocked scripts, declined consent |
| Server logs | Every request the server handled | Bots and assets mixed in; no conversions |
| Search console data | Impressions, clicks and position in search | Omitted queries; 2 to 3 day delay |
| Panel and modelled estimates | Modelled visits for any domain | Estimates; weak on small sites |
Each type answers different questions; see the matrix in the article.
What question does each type answer?
Pick the type from the question, not from the brand. The matrix below maps nine common questions to the type that can answer them honestly.
| Question | On-site analytics | Server logs | Search console | Panel estimates |
|---|---|---|---|---|
| How many people visited last week? | Yes (what the tag saw) | Requests, not people | No | Estimate only |
| Which channel sent the converting visitors? | Yes | No (no conversion event) | Search only | No |
| Which pages do people enter and leave on? | Yes | Requests only | Landing pages from search | No |
| Which search queries brought clicks? | No | No | Yes (with omissions) | No |
| How much of my traffic is bots? | Only what is identified | Yes (user agent, if logged) | No | No |
| Which pages did crawlers hit? | Not unless crawlers run scripts | Yes | No | No |
| Did traffic drop because of tracking, or for real? | Compare against logs | Yes | Compare search clicks | No |
| How big is a competitor's site? | No | No | No | Yes (rough) |
| Did a campaign convert? | Yes, with UTM and goals | No | No | No |
Two patterns in the table: your own questions need first-party sources, and competitor questions only have estimates. Use the right source for the right question, and do not mix their numbers in one chart.
Why do the tools disagree?
They disagree because they count different things and fail in different ways. Three facts frame the gaps.
- A large share of requests are not people. Imperva's 2025 Bad Bot Report puts automated traffic at 51% of all web traffic and bad bots at 37%. Logs record those requests; most analytics tags never fire for them.
- Logs have only what the server wrote. In Apache's common log format, a line has the client address, time, request line, status and response size; referrer and user agent appear only in the combined format or when you add them.
- Search console data is partial and late. Google's Search Console documentation says some queries are omitted to protect privacy, tables show at most 1,000 rows and data should normally be available in 2 to 3 days.
Sample data: reconcile one month for one site.
| Source | Reading | Reconciliation |
|---|---|---|
| Server logs, HTML requests with status 200 | 52,000 | |
| Of which identified as known bots by user agent | 9,100 (17.5%) | 52,000 − 9,100 = 42,900 human-looking requests |
| Analytics tag pageviews | 38,900 | 42,900 − 38,900 = 4,000 gap (9.3% of 42,900) |
| Search Console clicks | 7,800 | Analytics organic-search sessions 7,100; 7,100 ÷ 7,800 = 0.91 |
| Panel-based estimate of visits | 31,000 | Tag shows 21,400 sessions; 31,000 ÷ 21,400 = +45% |
Reading it: removing known bots explains most of the gap between logs and the tag; the remaining 4,000 requests (9.3%) are the range where blocked scripts, declined consent, cached pages, non-JavaScript clients and unidentified bots live. Search Console clicks are close to analytics organic sessions (0.91), a plausible gap, since some search clicks never become a recorded visit (a blocked script or a closed tab). The panel estimate is 45% above the tag count, so use panel numbers for ranking competitors, never for your own reporting.
One month, one site: logs versus tag
page requests / pageviewsWhat rule tells you which number to trust?
Use this order:
- For your own volume, trust the tag, after checking it against logs: if the tag sits within roughly 10% of human-looking log requests (a working rule for the sample, not an industry benchmark), it is healthy. If it is far below, the tag is broken or blocked on some pages.
- For bots, trust logs, because they see requests that never run scripts.
- For search queries, trust search console, and expect omissions and a 2 to 3 day delay.
- For competitors, use estimates, label them as estimates and compare ratios, not absolutes.
Write down which source answers which question, so a month later nobody puts a log count next to a tag count in the same chart.
What makes the tag undercount, and how do you check each cause?
When the tag runs below the human-looking log requests, check these causes in order, cheapest first:
| Cause | How to check | Fix |
|---|---|---|
| Tag missing on some templates | Compare the gap by page type; one template with a 100% gap is missing the tag | Add it to the shared layout |
| Single-page app does not send route changes | Logs show many HTML requests but the tag shows one pageview per visit | Send a pageview on every route change |
| Script blocked by the browser or an extension | Gap is larger on desktop browsers with blocking tools | Accept the gap, or add a server-side event for the key actions |
| Visitors declined consent | Gap appears after a banner change or only in regions that require consent | Know which tier your consent setting leaves you in, and report the gap |
| Unidentified bots in the log count | Look at user agents and request rates per IP in the log | Extend the bot list and recount |
Each row has an observable symptom, so you can explain the gap with evidence instead of guessing.
Which type do you need first?
Match the type to your situation instead of buying all four.
| Situation | Start with | Add next |
|---|---|---|
| New site, no data | On-site analytics | Search console |
| Traffic dropped and you do not know why | Search console and logs | The tag, to compare |
| Heavy bot or scraper traffic | Server logs | An analytics tool that separates bots |
| Paid campaigns | On-site analytics with UTM and goals | Spend import, if available |
| Competitor benchmark for a pitch | Panel estimates | A first-party number for your own site |
| Privacy-sensitive audience | On-site analytics with an IP-free setup | Logs, if you own the server |
A reasonable default: on-site analytics plus search console answer the great majority of questions, and logs are the tie-breaker when the two disagree. Add the others when a question needs them.
What do estimates really tell you?
Panel and modelled estimates combine several inputs. One provider's data page lists direct measurement from first-party analytics, anonymous data from software installed on devices, public data and partner data, and says it extrapolates these signals into a picture of online activity. That is a model, so treat every figure as a range.
Practical use: compare your estimate with your own actuals once. If the estimator says 31,000 visits and your tag says 21,400, you now know it runs about 45% high for sites like yours. Apply that ratio to competitors in the same size band only as a rough sanity check; do not quote the result as a fact.
How do you check your own setup in an afternoon?
A short audit finds most reporting errors:
- Pick one week and one page type (for example, article pages).
- Count human-looking log requests for that week after removing known bot user agents.
- Compare with tag pageviews for the same URLs. Record the gap as a percentage.
- Compare Search Console clicks with analytics organic sessions for the same week.
- Re-check after any change to the tag, the consent banner or the CDN.
Keep the percentages in a table with the date. Next month's gap tells you whether something broke.
How do you do this in TapCub?
Start from the reconciliation table above and use TapCub for the on-site and bot rows.
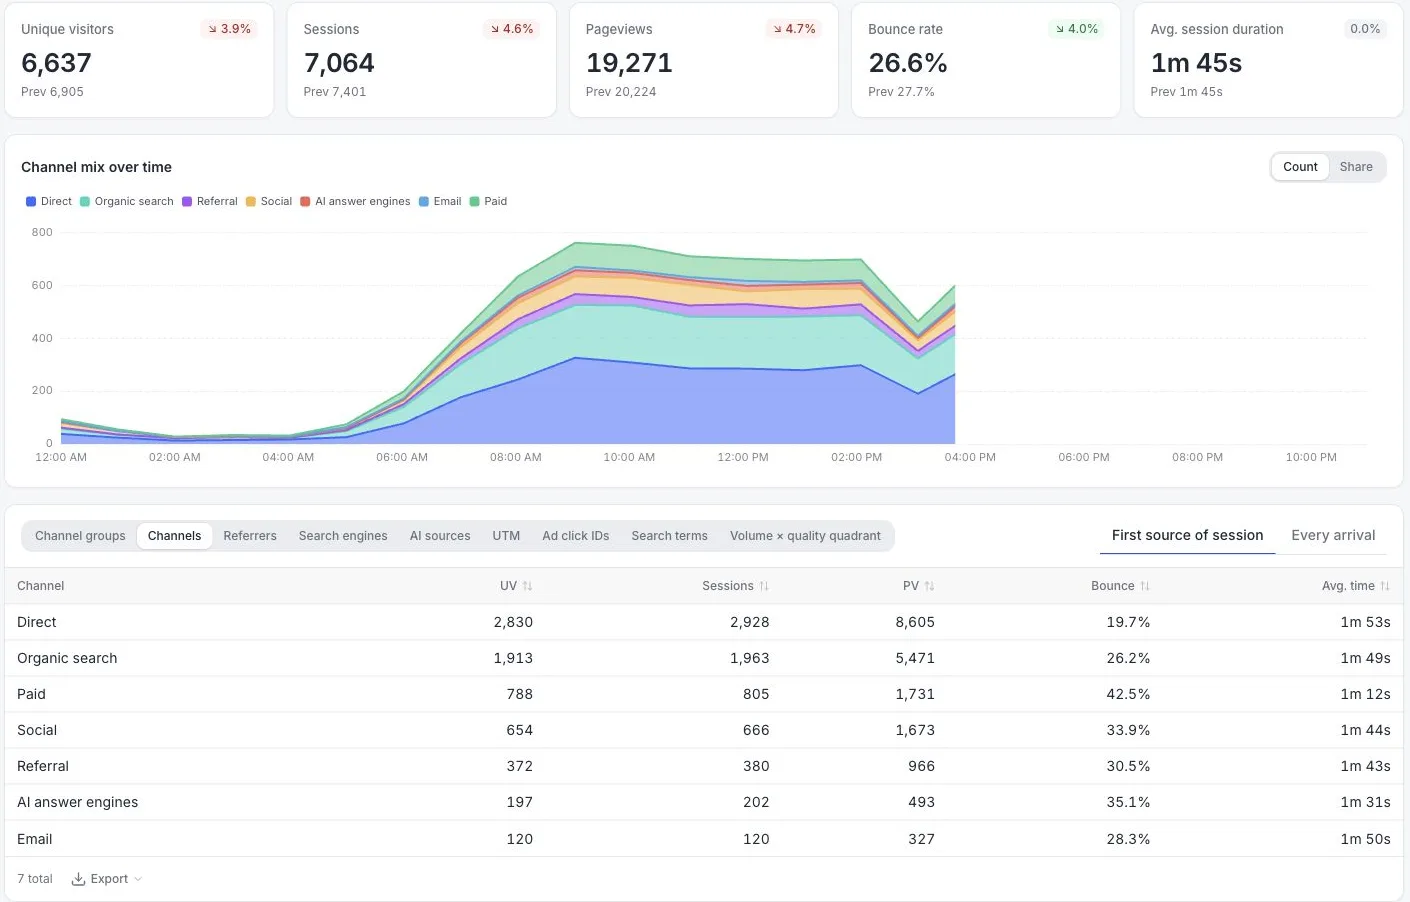
- On-site analytics. One script gives visitors, pages and sources. Web analytics › Sources breaks traffic into channels, sources and UTM parameters; Web analytics › Pages shows the pages visitors enter and leave on.
- Bots, separated. Web analytics › Bots has the tabs AI & agents, All bots and Visits. New projects identify bots and count them only on that report, so they do not inflate visitor counts or lower conversion rates. This is the bot row of the table, measured at the tag instead of guessed from logs.
- Search queries. Connect Google Search Console or Bing Webmaster in Monitoring › Search performance to see clicks, impressions, click-through rate and average position by page, query and country; data is normally 1 to 3 days late.
- Logs. All-platform analytics › Data › Data import accepts Nginx and Apache logs, up to 100,000 lines per file. Log import skips crawlers, so crawler data comes from the server-side API; do not expect an imported log to reproduce the bot count above.
- What it does not do. TapCub does not estimate competitors' traffic. Use a panel-based estimator for that, and keep it out of your own reporting.
FAQ
What are website traffic analysis tools?
They measure how many people visit a website, where they come from and what they do. The main types are on-site analytics, server logs, search console data and panel-based estimates; each counts something different, so use the type that fits the question.
What is the difference between analytics and server logs?
An analytics tag counts what the browser can report, so it sees people, sources and events but misses blocked scripts and most bots. Logs record every request the server handled, including bots and assets, but contain no conversion events.
Are website traffic estimates accurate?
They are modelled, not measured, and are least reliable on small sites. Compare an estimate with your own actuals once, as in the sample (31,000 against 21,400), then use it only to compare competitors with each other.
How much website traffic is bots?
Imperva's 2025 report puts automated traffic at 51% of web traffic and bad bots at 37%. Your own share differs; check logs or a bot report for your site, because a high bot share inflates visits and depresses conversion rates.
Do I need more than one tool?
Usually two: on-site analytics for visitors and conversions, plus search console for queries. Add logs when numbers disagree, and a panel estimator only for competitor comparisons.
See also: Comparing Website Traffic: How to Compare Two Sites Fairly.
Sources
- Imperva. 2025 Bad Bot Report — 51% automated traffic, 37% bad bots. Verified 2026-11-20.
- Apache HTTP Server Project. Log files — common log format fields; referrer and user agent only in the combined format or added. Verified 2026-11-20.
- Google. Search Console: about the data — omitted queries, 1,000-row limit, 2 to 3 day delay. Verified 2026-11-20.
- Similarweb. Our data — direct measurement, device panel, public and partner data, extrapolation. Verified 2026-11-20.
Was this article helpful?
We use your answers to fix and expand this page.
Couldn’t send. Please try again in a minute.
Thanks for the feedback. We’ll use it to improve this page.You’ve already sent feedback on this page. Thanks.

Data Analyst
Explores traffic sources, conversion funnels, and retention, using clear metric definitions and concrete examples to explain what the numbers mean.