Try it on your own data
Every report in this article is in the free plan. One snippet for web and apps, up to 10 sites.
Start freeTo compare website traffic fairly, use the same metric, dates and site scope, trust trends and ratios more than levels, and treat a competitor's estimated number as a range. In a 2022 study of 86 websites one estimator's total visits were 62.2% of Google Analytics' and its unique visitors 52.6%. Calibrate the tool on your own site first, then call a ranking only when the estimate lies outside the band your calibration allows.
What you will learn
- Estimators are good at direction and growth, poor at levels: in a 86-site study one tool's visits were 62.2% of Google Analytics' in total
- Calibrate on your own site each month, then report the competitor as a range, such as 111,111 to 153,846 for an estimate of 100,000
- Call a ranking only outside the band: below 81,900 or above 113,400 for a site whose own count is 126,000
How do you compare website traffic fairly?
Compare the same metric, over the same dates, for the same scope of site, and trust trends and ratios more than absolute numbers. Your own site's traffic comes from your own analytics, which count what happened on your pages. A competitor's traffic can only come from an estimator that models it from samples, so its level will be off in an unknown direction. The method below calibrates the estimator against your own site, then only calls a ranking when the gap is bigger than the calibration spread. For the tools themselves, see website traffic analysis tools; for what to benchmark besides visits, see competitor benchmarking.
Why do estimates and your own analytics disagree?
They measure different things in different ways.
- Your analytics reads a script or server data on your own pages. It sees every visit it can run on, and applies its own definitions of a visit, a visitor and a bounce.
- A traffic estimator cannot see anyone else's server. It builds a model from samples and then extrapolates to the whole site, so errors are expected.
- Automation is counted differently. Imperva's 2025 Bad Bot Report found that automated requests were 51% of all web traffic in 2024. A figure that includes automated hits and one that counts only people are not comparable at all.
The result is not that estimators are useless. It is that they are a different instrument, and you should know how far off it is before you read it.
How large is the gap?
A peer-reviewed study gives a concrete answer for one estimator. Jansen, Jung and Salminen (PLOS ONE, 2022) compared Google Analytics with SimilarWeb on 86 websites from 26 countries and 19 industries, over September 2019 to August 2020, monthly averages.
| Metric | Google Analytics total | SimilarWeb total | SimilarWeb as a share of GA | Sites it over / under / roughly matched |
|---|---|---|---|---|
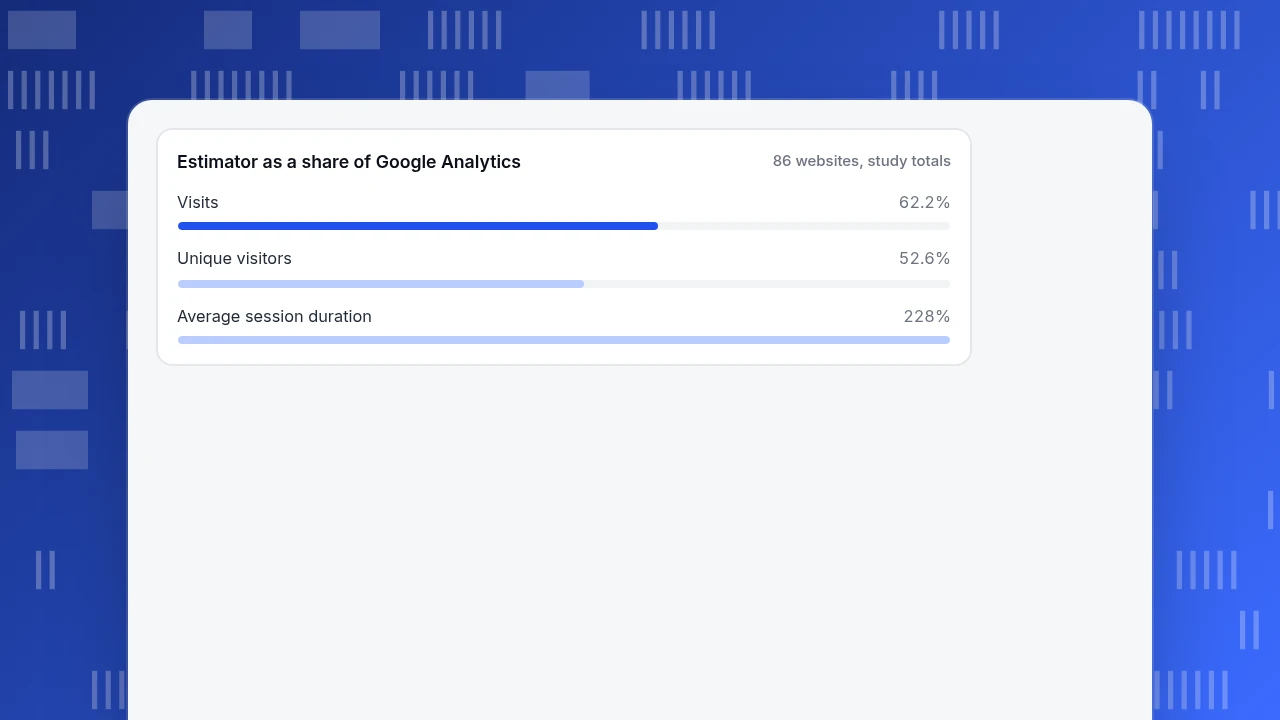
| Visits | 1,703.5 M | 1,060.1 M | 62.2% | 15 / 66 / 5 (17.4% / 76.7% / 5.8%) |
| Unique visitors | 834.7 M | 439.0 M | 52.6% | 4 / 82 / n/a (4.7% / 95.3%) |
| Bounce rate (average) | 56.2% | 63.0% | +6.8 points | 35 over / 31 under / 20 within 5 points |
| Average session duration | 202.91 s | 463.51 s | 2.28 times | 63 over / 9 under / 14 roughly matched |
(The ratios in the third column are our own, computed from the totals the paper reports.) Three things stand out. Visits were under-estimated on 66 of 86 sites, but over-estimated on 15, so the direction is not fixed. Unique visitors were off by almost half. Session duration and bounce rate were so far apart that comparing their levels across tools is meaningless. This is one tool, one period and 86 sites, so treat the numbers as a warning of the order of magnitude, not as a correction factor for your sites.
| Metric | Compare across sites? | Why |
|---|---|---|
| Direction of change | Yes | Matched in every month of the example |
| Growth over months | Yes, approximately | 26.0% own against 26.5% estimated |
| Visits or sessions (level) | Only with a range | 62.2% of Google Analytics in the study |
| Unique visitors | Avoid | 52.6% of Google Analytics in the study |
| Bounce rate and duration | Avoid across tools | 2.28 times apart on duration |
Study: Jansen, Jung and Salminen (PLOS ONE, 2022), 86 websites.
Worked example: calibrate on your own site, then compare
Sample data: you run Site A and can see its analytics. A competitor, Site B, is visible only in an estimator. First compare the estimator with your own numbers for Site A over six months.
| Month | Own sessions | Estimator | Estimator ÷ own |
|---|---|---|---|
| 1 | 100,000 | 66,000 | 0.660 |
| 2 | 104,000 | 69,000 | 0.663 |
| 3 | 110,000 | 73,500 | 0.668 |
| 4 | 108,000 | 70,000 | 0.648 |
| 5 | 118,000 | 79,500 | 0.674 |
| 6 | 126,000 | 83,500 | 0.663 |
Over the six months the estimator is at 66.3% of your own count (441,500 against 666,000), and the ratio stays in a narrow band of 0.648 to 0.674. The month-to-month changes point the same way every month (own +4.0%, +5.8%, −1.8%, +9.3%, +6.8%; estimator +4.5%, +6.5%, −4.8%, +13.6%, +5.0%), and the two series correlate at 0.99, but the size of the swings differs: month 4 is +9.3% on your own data and +13.6% in the estimator. Six-month growth is 26.0% against 26.5%. So the estimator is good for direction, roughly right on growth and poor on level.
Now Site B. The estimator says 100,000 sessions in month 6. What is B really? If B's ratio were the same as A's (0.663), B would be about 150,800. But the ratio for another site is unknown, and the study above shows it can be well below or above. Assume a plausible range of 0.65 to 0.90:
- At 0.90, B is 100,000 ÷ 0.90 = 111,111.
- At 0.65, B is 100,000 ÷ 0.65 = 153,846.
Site A's real figure is 126,000. B could be 12% below you or 22% above you, so you cannot say who is ahead. The call becomes possible only when the estimate lies outside a threshold band: below 81,900 (126,000 × 0.65) A is ahead at any ratio in the range; above 113,400 (126,000 × 0.90) B is ahead at any ratio in the range. At 100,000, B sits in the middle, and the honest answer is "similar size, order of ranking unknown".
Estimator as a share of Google Analytics
86 websites, study totalsWhich metrics are safe to compare?
| Metric | Use across sites? | Why |
|---|---|---|
| Direction of change (up or down, month to month) | Yes | Matched in every month of the example |
| Growth over several months | Yes, as approximate | 26.0% own against 26.5% estimated |
| Share of traffic by channel | With care | Ratios cancel some bias, but source detection differs by tool |
| Visits or sessions (level) | Only with a calibration range | 62.2% of GA in the study; 65% to 90% of the real figure in the example's assumed range |
| Unique visitors | Avoid | 52.6% of GA in the study, and each tool's dedup differs |
| Bounce rate and session duration | Avoid across tools | 2.28 times apart on duration in the study |
What is the checklist for a fair comparison?
- Same metric name, same definition. Visits, sessions, visitors and users are different things. State which you use.
- Same dates. Same calendar months, and note any sale or launch inside the period.
- Same scope. The root domain or one subdomain, desktop and mobile together or one at a time, one country or all.
- Humans only. Remove or separate automated traffic in your own numbers, so you know which count you are comparing.
- Calibrate. Compare the estimator with your own data every month and keep the ratio. If it drifts by more than a few points, something changed in the tool or on your site.
- Use a range. Report competitor figures as a band, and state the band you used.
- Say what you compared. "Estimated sessions, same estimator, June" is a claim. "B has more traffic than us" is not.
How do you do this in TapCub?
TapCub measures your own sites. It does not measure competitors, so the estimator stays outside it. Use TapCub for the calibration side of the example.
- Fix the definitions. In Web analytics › Overview, sessions are cut after 30 minutes idle (24 hours at most), and visitors are deduplicated on the visitor ID. The overview card adds each day's visitors, so one person on three days counts three times. For people deduplicated across the whole range (up to 93 days), use the range-wide figure under the data report, which is the closer match to an estimator's monthly unique visitors.
- Compare periods. Set the date range and switch the comparison to the previous period, then record sessions each month beside the estimator's number, as in the six-month table.
- Keep bots out. Automated traffic is counted on its own report (Web analytics › Bots) and is not mixed into the visitor and session totals. That is the human-only side of the checklist.
- Compare on the same scope. Click a row on pages, sources or audience tables to add a filter, and the hostname filter stays as you move between reports.
- Share a like-for-like view. If a partner will compare, Configuration › Settings › Public sharing creates a read-only link to selected modules (overview, pages, sources, audience, bots), with an optional password and a cap on how many days are visible. Visitor lists and sessions cannot be shared.
TapCub does not see another company's traffic, so the competitor side stays an estimate.
Which claims can you make from estimates?
Write the claim so that it only says what the data supports:
| Claim | Supportable? | Why |
|---|---|---|
| "B's estimated sessions grew 12% over three months; ours grew 9%" | Yes, with the same estimator for both periods | Growth and direction held up in the six-month table |
| "B's traffic is about 110,000 to 155,000 sessions a month" | Yes, as a range | It states the calibration spread |
| "B has more traffic than we do" | Not at 100,000 against your 126,000 | The range spans both sides of your number |
| "B's visitors stay twice as long as ours" | No | Duration was 2.28 times apart between tools in the study |
If a claim goes into a board paper or a pitch, put the estimator's name, the month and the range next to it.
What are the common mistakes?
- Treating an estimate as a count. The study found visits off on 81 of 86 sites by more than the ±5% band.
- Comparing levels across tools. A site in one tool and a competitor in another mixes two errors.
- Comparing unique visitors. They were the weakest metric in the study.
- Ignoring scope. One site's number may include subdomains or both device classes and the other's may not.
- Calling a ranking inside the error band. 100,000 estimated sessions can be 111,000 to 154,000.
FAQ
How can I compare my website traffic to a competitor's?
Use an estimator for the competitor and your own analytics for yourself, calibrate the estimator against your own site, and compare trends and ratios. Report the competitor as a range.
How accurate are website traffic estimators?
In the 2022 PLOS ONE study, one estimator's visits were 62.2% of Google Analytics in total on 86 sites; it under-estimated 66, over-estimated 15 and matched 5 within about 5%. Accuracy differs by tool.
Which metric is best for comparing two sites?
Direction and growth over several months are the most reliable. Visits can be compared with a calibration range. Unique visitors, bounce rate and duration should not be compared across tools.
Can I see a competitor's analytics?
Only what they choose to share. Public share links expose selected views of their own data; otherwise you rely on estimates.
How often should I recalibrate?
Monthly is enough for most sites. If the estimator-to-own ratio moves by more than a few points, check for a change in your tracking, a bot spike or a tool update.
Sources
Was this article helpful?
We use your answers to fix and expand this page.
Couldn’t send. Please try again in a minute.
Thanks for the feedback. We’ll use it to improve this page.You’ve already sent feedback on this page. Thanks.

Customer Experience Consultant
Writes about live chat, visitor conversations, and self-service, sharing practical ways to make customer communication clearer and more effective.