Try it on your own data
Every report in this article is in the free plan. One snippet for web and apps, up to 10 sites.
Start freeCohort analysis in marketing groups people by the campaign that acquired them and follows each group week by week, so you can compare retention and cost per retained user instead of cost per signup. In the sample below, paid search is cheaper than creator referral per signup ($8.00 against $10.00) but nearly three times as expensive per user still active in week 4 ($88.89 against $30.30). Check cohort sizes before you move budget on a gap.
What you will learn
- Compare campaigns by cost per retained user, not per signup: paid search ranks above creators on the first and far below on the second
- Use the same start event, return event and age (week 4 against week 4) for every cohort
- Put a 95% interval on small cohorts: 300 people give 27.9% to 38.5%, which overlaps the email cohort
What is cohort analysis in marketing?
Cohort analysis in marketing groups people by the campaign or channel that brought them in, then follows each group over the weeks after it arrived. The basic number is retention in period k: people from the cohort who came back in period k, divided by the cohort size. It answers a question that a campaign report cannot: of the people each campaign acquired, how many are still active a month later, and what did each of them cost? For the general method, see how to do cohort analysis and the cohort glossary entry; this guide is about comparing campaigns.
Why compare campaign cohorts rather than one blended number?
A blended retention figure mixes groups that behave very differently, and it moves whenever your channel mix moves. Suppose last month's blended week-4 retention was 17.7% and this month's is 21%. Either every campaign improved, or you simply bought less from the weakest one. Only a cohort table per campaign tells you which.
It also matters for money. ChartMogul's 2023 SaaS Retention Report, which analysed more than 2,100 SaaS businesses, found that companies with gross revenue retention above 85% grew at least 1.5 to 2.5 times faster than the rest. Retention is not a side metric: it decides how much each acquired customer is worth. See good retention rate for how to judge your own level.
Worked example: three campaign cohorts
Sample data: three campaigns whose new signups arrived in the same week. "Active" means the person performed at least one core action in the week.
| Cohort | Signups | Week 1 | Week 2 | Week 3 | Week 4 |
|---|---|---|---|---|---|
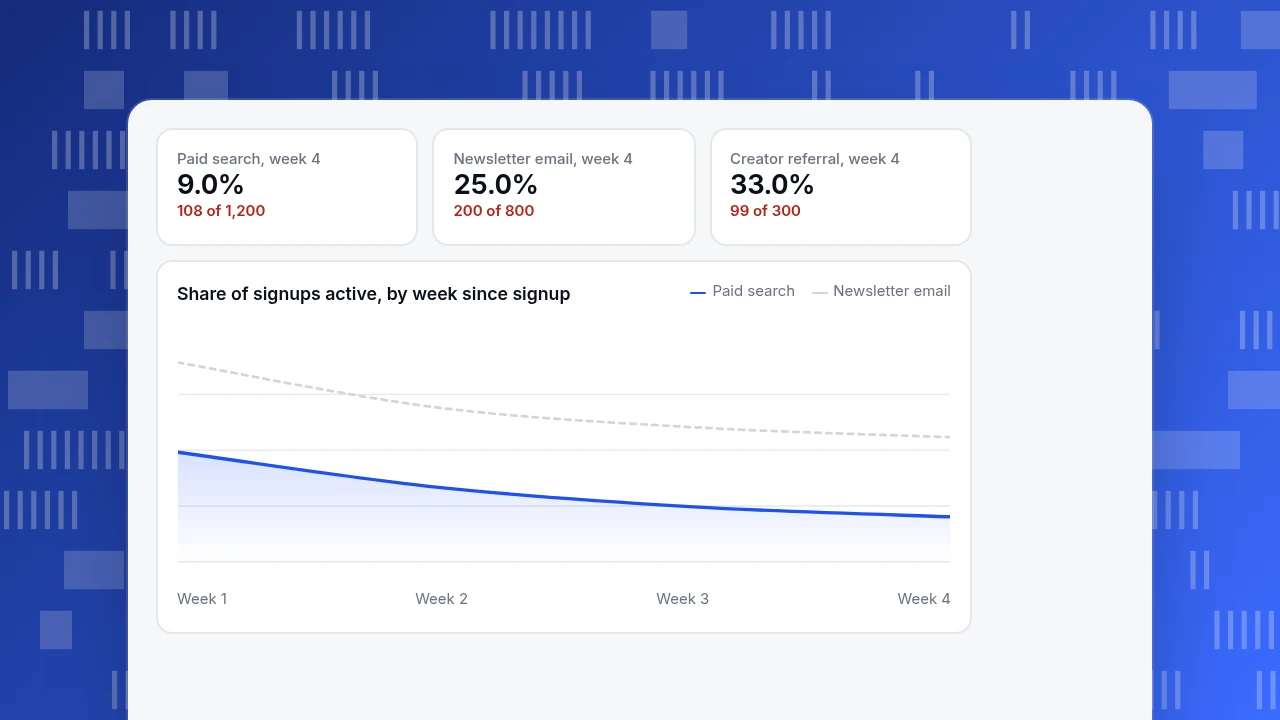
| Paid search | 1,200 | 22.0% (264) | 15.0% (180) | 11.0% (132) | 9.0% (108) |
| Newsletter email | 800 | 40.0% (320) | 31.0% (248) | 27.0% (216) | 25.0% (200) |
| Creator referral | 300 | 48.0% (144) | 40.0% (120) | 36.0% (108) | 33.0% (99) |
| All cohorts (size-weighted) | 2,300 | 31.65% (728) | 23.83% (548) | 19.83% (456) | 17.70% (407) |
The blended line says 17.7% of signups are still active in week 4. That hides a range from 9.0% to 33.0%. The creator cohort keeps 68.8% of its week-1 actives into week 4 (99 of 144); paid search keeps 40.9% (108 of 264); email keeps 62.5% (200 of 320). The curves also have different shapes: paid search loses 31.8% of its week-1 actives by week 2 (264 to 180), while email loses 22.5% and creators 16.7%.
Paid search, week 4
9.0%
108 of 1,200
Newsletter email, week 4
25.0%
200 of 800
Creator referral, week 4
33.0%
99 of 300
Share of signups active, by week since signup
Paid searchNewsletter emailWhat did each cohort cost?
Add spend to the same table. Sample spend: paid search $9,600, newsletter promotion $1,600, creator fees $3,000.
| Cohort | Spend | Cost per signup | Active in week 4 | Cost per week-4 active user |
|---|---|---|---|---|
| Paid search | $9,600 | $8.00 | 108 | $88.89 |
| Newsletter email | $1,600 | $2.00 | 200 | $8.00 |
| Creator referral | $3,000 | $10.00 | 99 | $30.30 |
| All | $14,200 | $6.17 | 407 | $34.89 |
The ranking flips. By cost per signup, creator referral is the most expensive ($10.00) and paid search is in the middle ($8.00). By cost per user still active in week 4, paid search is far the most expensive ($88.89 against $30.30 for creators). Two decisions follow from these numbers:
- At $8.00 per signup, paid search would need about 26.4% week-4 retention ($8.00 ÷ $30.30) to match creators on cost per retained user; it has 9.0%.
- Or, at 9.0% retention, its cost per signup would need to be about $2.73 ($30.30 × 0.09).
Neither is impossible, but a cost-per-signup report would never have raised the question.
| Cohort | Cost per signup | Cost per week-4 active user |
|---|---|---|
| Paid search | $8.00 | $88.89 |
| Newsletter email | $2.00 | $8.00 |
| Creator referral | $10.00 | $30.30 |
| All cohorts | $6.17 | $34.89 |
Sample data: spend $9,600, $1,600 and $3,000 on 1,200, 800 and 300 signups.
Is the difference between cohorts real?
The creator cohort has only 300 people. Compute a 95% Wilson interval for week-4 retention (the formula the NIST engineering handbook gives for a proportion):
| Cohort | Week-4 retention | 95% interval |
|---|---|---|
| Paid search | 9.0% (108 of 1,200) | 7.5% to 10.8% |
| Newsletter email | 25.0% (200 of 800) | 22.1% to 28.1% |
| Creator referral | 33.0% (99 of 300) | 27.9% to 38.5% |
Paid search is clearly below the other two. Creator referral and email overlap slightly (27.9% to 28.1%), so the sample cannot tell you creators retain better than email, only that both retain much better than paid search. For the creator-versus-email call, wait for a second creator cohort before moving budget.
How long should you wait before judging a campaign?
Waiting costs money too, so decide in advance which week you will read. In the example the week-1 numbers already put the cohorts in the final order: cost per week-1 active user is $5.00 for email ($1,600 ÷ 320), $20.83 for creators ($3,000 ÷ 144) and $36.36 for paid search ($9,600 ÷ 264), the same order as the week-4 costs ($8.00, $30.30 and $88.89). Treat week 1 as an early flag and week 4 as the decision, and only move budget on week 1 alone when the gap is as large as it is here and the cohorts are big enough to pass the interval check. A gap that appears at week 1 and closes by week 4 is common for campaigns with a slow onboarding, so do not stop a campaign on one cohort.
How do you define a cohort and a return correctly?
Two choices decide whether the table means anything.
- Who is in the cohort. Use the moment of acquisition: first visit from the campaign, first signup, first purchase. Google Analytics' cohort exploration, for example, includes people by first touch or by a chosen event. Do not define the cohort by a later action, or you start measuring a different thing.
- What counts as a return. Choose a core action, not just a visit. In the example "active" means a core action. If "return" is any pageview, retention is higher for every campaign and the gaps shrink.
Mind the calendar too. Weekly cohorts in Google Analytics run Sunday through Saturday, not rolling seven days, so a person who signs up on a Saturday starts week 1 almost immediately. Its cohort exploration shows at most 60 cohorts, and with a breakdown dimension it keeps the top 15 values. A period that has not ended yet should be blank, not zero. For terms, see what a cohort is.
How do you read the table?
| Pattern | What you see | What it suggests |
|---|---|---|
| Curve flattens | Rates fall fast then stop falling (creator: 48, 40, 36, 33) | A core of retained users; compare the level where it flattens |
| Early cliff | Big drop between week 1 and 2 (paid search: 22 to 15) | Onboarding or expectation problem for that campaign |
| New cohorts worse than old | Same week, lower rate down a column | Channel quality or product change, check what changed |
| One column dips for all cohorts | A shared calendar event | Holiday, outage or release, not a campaign effect |
Read across a row for one campaign's life, down a column for the same age across campaigns.
How to run this in TapCub
Take the three campaigns above.
- Make one group per campaign. In All-platform analytics › Users › Segments & tags, create a segment for each cohort. A live segment can capture people who arrived from a channel; a rule segment can use an event they did, a property or when they were first seen. Anonymous visitors have no profile, so set the segment identity to visitor if you are not identifying logged-in users.
- Open retention. In All-platform analytics › Behavior › Behavior analysis, choose retention. Set the start event (signup) and return event (your core action), the period (week) and how many periods to show, up to 12 weeks.
- Apply the segment as the cohort. Retention has no breakdown and no compare period, so run it once per campaign. Each row is a cohort with its start date, size and count and rate per period; an unfinished period is empty, not zero; the line under the table is the size-weighted average, the number we computed as 17.70% for week 4.
- Bring in spend. In All-platform analytics › Business › Channel ROI, import spend by day, channel, source and campaign. TapCub then shows cost per click (spend ÷ sessions) and cost per acquisition (spend ÷ purchases in orders). Cost per signup or per week-4 active user, as in the example, you compute yourself from your spend and the cohort sizes.
Retention is unavailable if you run strict privacy mode, because the salt changes every day and people cannot be matched across days. TapCub also does not buy media or send the emails, so it measures the cohorts; budget moves happen in your ad and email tools.
What are the common mistakes in marketing cohort analysis?
- Judging by cost per signup. In the example it ranks paid search above creators; cost per retained user reverses that.
- Comparing cohorts of different ages. Compare week 4 with week 4, not a cohort's week 4 with another's week 2.
- Reading small cohorts as fact. 300 people give an interval of 27.9% to 38.5%.
- Treating any visit as a return. It inflates every curve and compresses the gaps.
- Mixing campaigns in one cohort. The blended 17.7% hid a range from 9.0% to 33.0%.
FAQ
What is cohort analysis in marketing?
It groups people by the campaign or channel that acquired them and follows each group over time to compare retention, repeat purchase or revenue. It shows quality of acquisition, not just volume.
How do you compare campaign cohorts?
Use the same start event, return event and period for every cohort, compare the same age (week 4 against week 4), and add spend so you can compare cost per retained user as well as cost per signup.
How big should a cohort be?
Big enough for a narrow interval. In the example, 1,200 people gave 7.5% to 10.8%, and 300 gave 27.9% to 38.5%. If an interval overlaps another cohort's, do not call a winner.
What retention period should I use?
Match it to how often people use the product: days for apps, weeks for most websites, months for subscriptions. Pick periods long enough that a normal user would have returned.
How is a marketing cohort different from a segment?
A cohort is defined by when and how people started and is followed over time. A segment is any group of people defined by what they did or are, and it can be used as a cohort.
Sources
- ChartMogul: SaaS Retention Report 2023 (2,100+ businesses, GRR above 85% grows 1.5 to 2.5 times faster), checked 2026-11-20
- Google Analytics Help: Cohort exploration (inclusion and return criteria, weekly Sunday to Saturday, 60 cohorts), checked 2026-11-20
- NIST/SEMATECH e-Handbook of Statistical Methods: confidence intervals for a proportion (Wilson interval), checked 2026-11-20
Was this article helpful?
We use your answers to fix and expand this page.
Couldn’t send. Please try again in a minute.
Thanks for the feedback. We’ll use it to improve this page.You’ve already sent feedback on this page. Thanks.

Product Experience Specialist
Writes about product experience, practical workflows, and growth, turning complex processes into clear steps for everyday decisions.