Try it on your own data
Every report in this article is in the free plan. One snippet for web and apps, up to 10 sites.
Start freeA CMO dashboard is a one-page view of ten metrics that tells the person who owns the marketing budget whether spend is turning into growth at a sustainable cost. Lay it out in four rows, from outcome (spend, sourced revenue) to efficiency (CAC, payback, ad return), funnel and channel, and health (retention, brand, satisfaction), and give every card a target and an owner. In the worked quarter below a blended payback of 10.0 months hides two channels at 14.29 and 18.75 months.
What you will learn
- Ten cards, four rows: outcome, efficiency, funnel and channel, health; each card has a target and a named owner
- Review by rhythm: weekly for conversion and channel traffic, monthly for spend, CAC and retention, quarterly for payback and satisfaction
- Always show the channel row beside the blended number: 10.0 months payback overall, 14.29 and 18.75 months for two channels
What is a CMO dashboard?
A CMO dashboard is a single page that shows whether marketing is producing growth at an acceptable cost, and where to move money or attention next. It is not a report of everything marketing measures. It has a small, fixed set of metrics, each with a definition, a target, an owner and a review rhythm, laid out so the top row says "are we on plan?" and the lower rows say why. The general ideas are in marketing dashboard and KPI dashboard; this guide gives a concrete layout for the person who owns the whole marketing budget.
Who reads it, and what do they decide with it?
Three readers use the same page for different decisions, and the layout should serve all of them without becoming three dashboards.
| Reader | Question | Decision |
|---|---|---|
| CMO | Which channels deserve more or less budget next quarter? | Reallocate spend, stop or scale a channel |
| CEO or CFO | Is marketing spend turning into revenue at a sustainable cost? | Approve budget, set payback limits |
| Channel leads | What did my channel contribute and what did it cost? | Fix targeting, creative, landing pages |
If a card does not change any of these decisions, it does not belong on the page.
What are the 10 metrics, and who owns each?
| # | Metric | Definition | Cadence | Owner |
|---|---|---|---|---|
| 1 | Spend vs plan | Marketing spend to date ÷ plan to date | Monthly | CMO with finance |
| 2 | Marketing-sourced revenue or pipeline | Revenue or pipeline from deals whose first or last touch was marketing | Monthly | Revenue operations |
| 3 | Blended and channel CAC | Spend ÷ new customers, total and by channel | Monthly | Marketing operations |
| 4 | CAC payback | CAC ÷ monthly gross margin per customer | Quarterly | Finance |
| 5 | Conversion by stage | Visitor to lead, lead to customer, by month | Weekly | Growth lead |
| 6 | Traffic and conversions by channel | Sessions and conversions per channel | Weekly | Channel leads |
| 7 | Return on ad spend by channel | Revenue ÷ ad spend | Weekly or monthly | Paid media lead |
| 8 | Retention | Gross revenue retention, or active-user retention for free products | Monthly | Lifecycle or customer success |
| 9 | Brand demand | Branded search queries and direct share of sessions | Monthly | Brand lead |
| 10 | Customer satisfaction | NPS or a satisfaction score | Quarterly | Customer experience |
Cadence follows how fast a number can change and how fast anyone can act on it. Conversion and channel traffic move weekly and can be fixed within days. Payback and satisfaction move over quarters, so reviewing them weekly would only produce noise.
| Metric | Cadence | Owner |
|---|---|---|
| Spend vs plan | Monthly | CMO with finance |
| Marketing-sourced revenue or pipeline | Monthly | Revenue operations |
| Blended and channel CAC | Monthly | Marketing operations |
| CAC payback | Quarterly | Finance |
| Conversion by stage | Weekly | Growth lead |
| Traffic and conversions by channel | Weekly | Channel leads |
| Return on ad spend by channel | Weekly or monthly | Paid media lead |
| Retention | Monthly | Lifecycle or customer success |
| Brand demand | Monthly | Brand lead |
| Customer satisfaction | Quarterly | Customer experience |
Sample dashboard plan; adjust owners to your organisation.
How should the page be laid out?
Group the ten cards into four rows, from outcome to cause:
- Outcome (cards 1, 2). Spend against plan and sourced revenue. This is the line that answers the CEO.
- Efficiency (cards 3, 4, 7). CAC, payback and return on ad spend. This row answers the CFO and decides budget.
- Funnel and channel (cards 5, 6). Conversion by stage and a channel table. This is where the CMO looks for the cause.
- Health (cards 8, 9, 10). Retention, brand demand and satisfaction, the slow-moving numbers that explain next year. For a subscription business, ChartMogul's 2023 report of more than 2,100 SaaS businesses is a useful anchor for card 8: companies with gross revenue retention above 85% grew at least 1.5 to 2.5 times faster than the rest.
Each card carries four things: the number, the change against the previous period, the target, and a status (on track, watch, act). A card without a target is a decoration. Put the owner's name in the card's footnote, so every red card has a person to ask.
What does the money context look like?
Use external benchmarks to sanity-check the spend card, not to set it. Gartner's 2025 CMO Spend Survey of about 400 marketing executives, fielded in February and March 2025 and weighted toward companies with more than $1 billion in revenue, found that average marketing budgets were 7.7% of company revenue, unchanged from 2024. Paid media was about 31% of budgets. Martech took 22%, labour 22% and agencies 21%.
For a smaller company those proportions are context rather than a target. A company with $15.6 million in revenue at the 7.7% average would spend $1,201,200 a year, or about $300,300 a quarter, which is the size of the sample quarter below.
Worked example: one quarter on the dashboard
Sample data: a company with quarterly marketing spend of $300,000 against a plan of $320,000, 250 new customers, $150 average monthly revenue per customer, 80% gross margin (so $120 of monthly margin per customer) and 2% monthly churn.
- Spend vs plan: $300,000 ÷ $320,000 = 93.75%.
- Blended CAC: $300,000 ÷ 250 = $1,200.
- CAC payback: $1,200 ÷ $120 = 10.0 months.
- Lifetime value: $120 ÷ 0.02 = $6,000 (this assumes a constant churn rate; real churn usually changes with customer age). LTV to CAC is $6,000 ÷ $1,200 = 5.0.
The blended numbers look healthy. The channel row tells another story:
| Channel | Spend | New customers | CAC | Payback at $120 a month |
|---|---|---|---|---|
| Paid search | $120,000 | 70 | $1,714 | 14.29 months |
| $30,000 | 60 | $500 | 4.17 months | |
| Events | $90,000 | 40 | $2,250 | 18.75 months |
| Content and SEO | $60,000 | 80 | $750 | 6.25 months |
| All | $300,000 | 250 | $1,200 | 10.00 months |
With a sample rule of "payback above 12 months needs review", two channels fail it: paid search at 14.29 months and events at 18.75 months. Together they take 70% of the spend ($210,000 of $300,000) and bring 44% of the customers (110 of 250). The dashboard has done its job when this table, not the blended 10.0 months, is what the CMO discusses. Whether to cut or fix those channels needs more evidence (later retention of those customers, assisted conversions), and this view is the trigger, not the verdict.
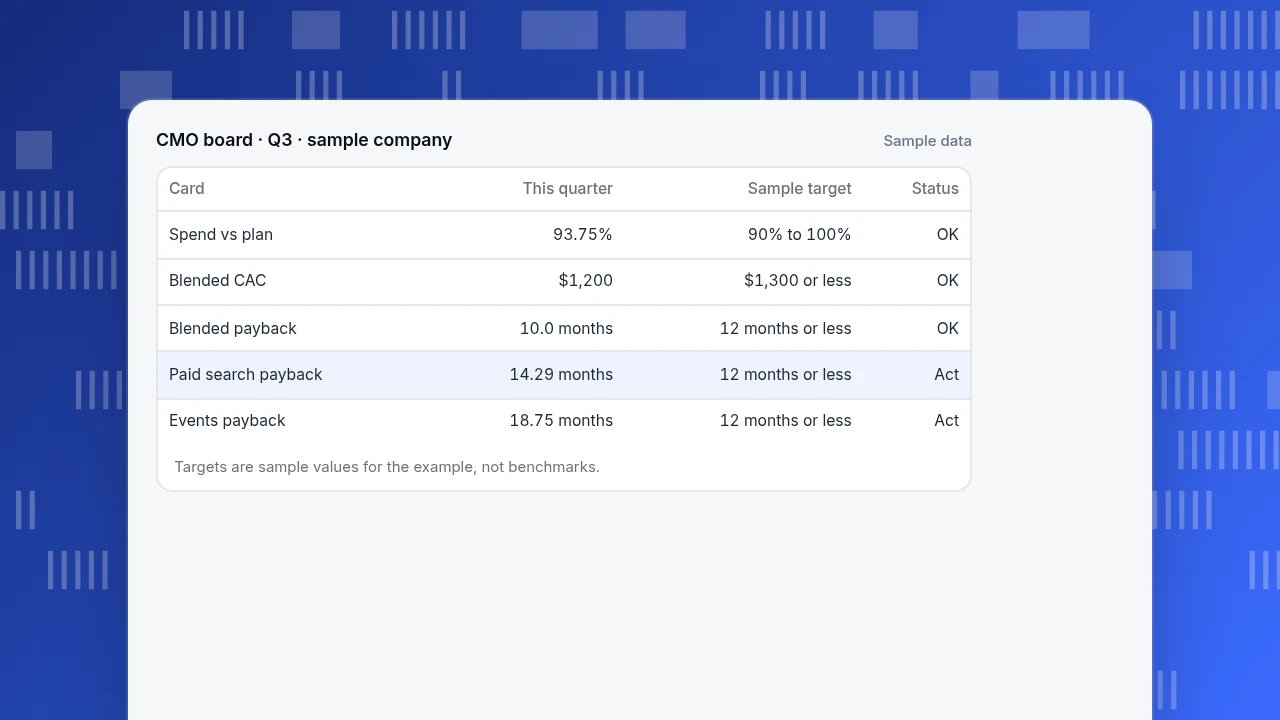
CMO board · Q3 · sample company
Sample data| Card | This quarter | Sample target | Status |
|---|---|---|---|
| Spend vs plan | 93.75% | 90% to 100% | OK |
| Blended CAC | $1,200 | $1,300 or less | OK |
| Blended payback | 10.0 months | 12 months or less | OK |
| Paid search payback | 14.29 months | 12 months or less | Act |
| Events payback | 18.75 months | 12 months or less | Act |
Targets are sample values for the example, not benchmarks.
Which of the ten can TapCub supply?
TapCub is an analytics product. It covers the website and product-behaviour side and leaves CRM, finance and survey data to other systems. Mapping the ten cards:
| Card | TapCub | Where |
|---|---|---|
| 1 Spend vs plan | Spend imported by day, channel, source and campaign; the plan itself stays in your finance sheet | All-platform analytics › Business › Channel ROI |
| 2 Sourced revenue or pipeline | Revenue on goals and orders, yes; pipeline, MQL and SQL, no (TapCub is not a CRM) | Web analytics › Goals |
| 3 CAC | Cost per acquisition = spend ÷ purchases in orders; for signups or deals, divide yourself | Channel ROI |
| 4 Payback and LTV | Not in TapCub; needs finance data | n/a |
| 5 Conversion by stage | Funnels with a window and breakdown | All-platform analytics › Behavior › Behavior analysis |
| 6 Traffic and conversions by channel | Channel table with visitors, sessions and conversions; attribution models can be compared side by side in Behavior analysis | Web analytics › Sources |
| 7 Return on ad spend | Ad spend return by channel, source or campaign | Channel ROI |
| 8 Retention | Activity retention by cohort (not revenue retention) | Behavior analysis |
| 9 Brand demand | Direct share in Sources; branded queries from Search Console | Monitoring › Search performance |
| 10 Satisfaction | No surveys; chat satisfaction in live chat reports only | Live chat › Reports |
To build the page in TapCub:
- Create a saved analysis for each card that is a query (funnel, retention, channel table).
- Open All-platform analytics › Overview › My dashboards and add the saved analyses as cards, with text blocks for targets and owners and dividers for the four rows. The board has its own date and filters, and can be made the default.
- Share it as a read-only link (optional password; viewers see at most the last 90 days), or subscribe to a report daily, weekly or monthly if your plan includes subscribed reports.
- Keep the bot split in mind: bots and AI crawlers are reported separately from visitors, so they do not inflate the traffic and conversion cards.
TapCub does not hold the plan, the pipeline or the survey; those cards come from your own sources.
How do you prepare the monthly review?
A dashboard only works if the meeting around it has a routine. A 30-minute monthly review can follow this order:
- Freeze the definitions the week before. If CAC or "new customer" changes, note it on the card, so a jump is not mistaken for performance.
- Pre-read the red cards. Each owner writes two lines on every card marked "act": what moved and what they will do.
- Spend the first 5 minutes on the top row, 15 on the channel row and 10 on decisions. Health cards (retention, brand, satisfaction) are read for direction only, and quarterly cards are skipped in the other two months.
- Record decisions in the dashboard itself. A text block with date, decision and owner stops the same question coming back next month.
In the sample quarter, the two "act" cards (paid search and events payback) would each get a two-line note before the meeting.
What are the common mistakes?
- Too many cards. Twenty metrics means no decision. Ten, each with an owner, is the upper end of what a quarterly review can hold.
- Blended numbers only. The 10.0 month blended payback hid 14.29 and 18.75 months.
- No targets. A number with no target cannot be red or green.
- Mixed cadences. Quarterly numbers in a weekly review create noise; weekly numbers in a quarterly review create anxiety.
- No definition. If marketing, sales and finance define "customer acquisition cost" differently, the dashboard becomes an argument.
FAQ
What should be on a CMO dashboard?
Spend against plan, sourced revenue, CAC and payback, conversion by stage, traffic and conversions by channel, return on ad spend, retention, brand demand and satisfaction. Ten cards, each with a target and an owner.
How often should a CMO review the dashboard?
Match the rhythm to each card: weekly for conversion and channel traffic, monthly for spend, CAC and retention, quarterly for payback and satisfaction.
How many metrics should a CMO dashboard have?
Ten is a practical ceiling. Beyond that, cards stop driving decisions. Move detail to channel dashboards owned by channel leads.
What is a normal marketing budget as a share of revenue?
Gartner's 2025 survey, mostly of companies with over $1 billion in revenue, found 7.7% on average. That is context for large companies, not a target for yours.
Can an analytics tool be a CMO dashboard?
It can supply the web, conversion, channel and retention cards. Spend plans, pipeline, payback and surveys come from finance, CRM and survey tools, so the dashboard often combines sources.
Sources
- Marketing Brew: Marketing budgets stagnate from 2024 to 2025, Gartner CMO Spend Survey (7.7% of revenue, 31% paid media, 22% martech, 22% labor, 21% agencies), checked 2026-11-20
- Gartner: 2025 CMO Spend Survey reveals marketing budgets have flatlined at 7.7% of overall company revenue (press release, 12 May 2025)
- ChartMogul: SaaS Retention Report 2023 (2,100+ businesses; gross revenue retention above 85% grows 1.5 to 2.5 times faster), checked 2026-11-20
Was this article helpful?
We use your answers to fix and expand this page.
Couldn’t send. Please try again in a minute.
Thanks for the feedback. We’ll use it to improve this page.You’ve already sent feedback on this page. Thanks.

Data Engineer
Writes about event design, data quality, and collection workflows, with verifiable implementation methods for reliable analytics.