Try it on your own data
Every report in this article is in the free plan. One snippet for web and apps, up to 10 sites.
Start freeChurn rate by industry ranges from a median 3.22% a year for SaaS to 4.99% for education on Recurly's July 2026 data, with 3.60% across all industries. Those are annual, subscriber-based medians, so they are comparable to yours only if your churn is too. Convert monthly rates with 1 − (1 − m)^12, match plan size, and match the measure: ChartMogul's revenue-based top quartile for low-price plans is 30% to 40% a year, about ten times Recurly's median.
What you will learn
- Recurly's July 2026 medians are annual and per subscriber: SaaS 3.22%, ecommerce 4.25%, education 4.99%, all industries 3.60%
- Convert before comparing: 2% a month is 21.53% a year, not 24%, and 5% a month is 45.96%
- Two real datasets can differ about tenfold (3.84% vs 30% to 40%) because they measure different things; pick the one that matches yours
What are typical churn rates by industry?
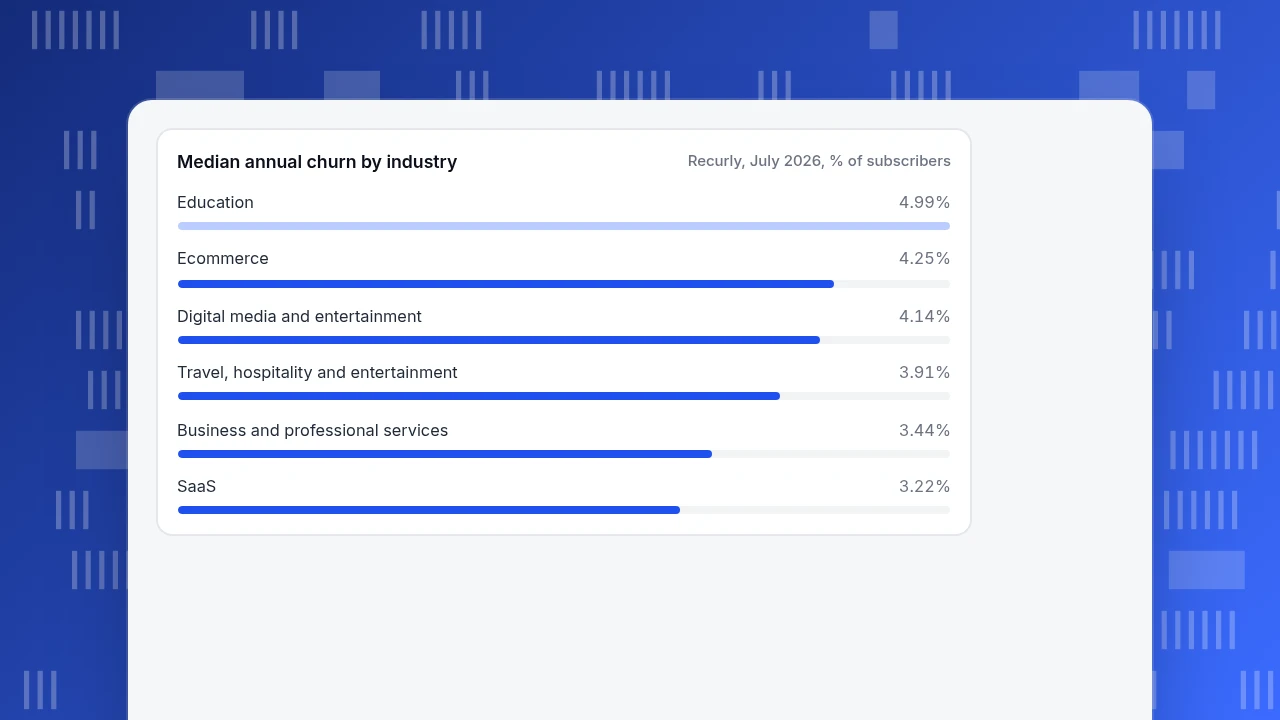
On Recurly's network data, median annual churn runs from 3.22% for SaaS to 4.99% for education, with 3.60% across all industries. These are the figures Recurly published with July 2026 data, for subscribers who cancelled or failed to renew within the year.
| Industry | Total annual churn | Voluntary | Involuntary |
|---|---|---|---|
| SaaS | 3.22% | 2.16% | 1.06% |
| Business and professional services | 3.44% | 2.27% | 1.18% |
| Travel, hospitality and entertainment | 3.91% | 2.63% | 1.28% |
| Digital media and entertainment | 4.14% | 2.55% | 1.59% |
| Ecommerce | 4.25% | 2.87% | 1.38% |
| Education | 4.99% | 3.30% | 1.69% |
| All industries (reference) | 3.60% | 2.34% | 1.25% |
Voluntary churn is a subscriber actively cancelling. Involuntary churn is a subscriber losing access because a payment failed. The involuntary share is between 33% and 38% of the total in every industry in the table (our calculation: involuntary ÷ total), which is why payment recovery is a churn lever even for a product people like.
Use the table as a reference point, not a target. The next sections explain what is inside the numbers, because the headline figure is only comparable to yours if the definitions match. For the formula itself, see how to calculate churn rate; for the relationship with retention, good retention rate.
Median annual churn by industry
Recurly, July 2026, % of subscribersWhat exactly do these numbers measure?
Recurly defines churn as the percentage of subscribers who cancel or fail to renew within a given period. Four details matter when you hold your own number against it:
- The period is a year. The table is annual, not monthly.
- The figures are medians. Half of Recurly's businesses in an industry are above the number and half below.
- The unit is subscribers. It counts people, not revenue. A business that loses its small customers keeps most of its revenue.
- The sample is not published. Recurly's page does not give the number of businesses or subscribers behind each row, and the page itself quotes two different SaaS medians (3.04% in the text, 3.22% in the table).
None of this makes the table wrong. It means you can compare it with a yearly, subscriber-based, start-of-year-cohort churn rate and with nothing else.
How does churn change with plan size?
Recurly also splits annual churn by average revenue per customer (ARPC):
| ARPC band | Total | Voluntary | Involuntary | Involuntary share |
|---|---|---|---|---|
| $10 to $25 | 4.29% | 2.99% | 1.30% | 30.3% |
| $25 to $50 | 3.84% | 2.73% | 1.11% | 28.9% |
| $50 to $100 | 3.15% | 2.41% | 0.74% | 23.5% |
| $100 to $250 | 2.87% | 2.40% | 0.46% | 16.0% |
| Over $250 | 3.07% | 2.90% | 0.18% | 5.9% |
(The last column is our own calculation: involuntary ÷ total.) Two patterns show. Churn falls from 4.29% to 2.87% as price rises to the $100 to $250 band, then edges up above $250. And almost all of the difference between bands is involuntary churn, which falls from 1.30% to 0.18%: the data does not say why. Voluntary churn barely moves: it stays between 2.40% and 2.99% in all five bands. If you compare yourself with an industry average and your plan price is far from it, the plan-size row is the fairer reference.
| Industry | Total annual churn | Involuntary |
|---|---|---|
| SaaS | 3.22% | 1.06% |
| Business and professional services | 3.44% | 1.18% |
| Travel, hospitality and entertainment | 3.91% | 1.28% |
| Digital media and entertainment | 4.14% | 1.59% |
| Ecommerce | 4.25% | 1.38% |
| Education | 4.99% | 1.69% |
| All industries | 3.60% | 1.25% |
Recurly network data, median annual churn, July 2026.
Why can monthly and annual churn not be compared directly?
Churn compounds. A monthly rate m becomes an annual rate of 1 − (1 − m)^12, which is less than 12m. Recurly's own example is that 2% monthly is roughly 22% a year, not 24%.
| Monthly churn | Annual churn |
|---|---|
| 0.5% | 5.84% |
| 1% | 11.36% |
| 2% | 21.53% |
| 3% | 30.62% |
| 5% | 45.96% |
Going the other way, Recurly's annual medians correspond to very low monthly rates: 3.22% a year is 0.272% a month, 3.60% is 0.305%, 4.25% is 0.361% and 4.99% is 0.426%. If a blog tells you that SaaS churn is "3 to 5%" and does not say whether that is monthly or annual, one reading is about ten times the other.
Why do two benchmark sources disagree by about ten times?
Compare the Recurly row for $25 to $50 per customer (3.84% annual churn) with ChartMogul's 2023 SaaS Retention Report, which analysed more than 2,100 SaaS businesses. ChartMogul reports that the top quartile of businesses with average revenue per account under $50 a month keeps 60% to 70% of its revenue over a year, which is gross revenue churn of 30% to 40%, and that was the top quartile. That is 7.8 to 10.4 times Recurly's median, for a similar price band.
The published pages do not let us reconcile them, and we would not guess. What we can see is that they differ in several ways at once:
| Recurly (July 2026) | ChartMogul (report 2023) | |
|---|---|---|
| Measure | Subscribers who cancel or fail to renew | Gross revenue retention, excluding expansion |
| Statistic | Median annual churn | Top-quartile retention |
| Population | Recurly network businesses | 2,100+ SaaS businesses, active for the full 12 months |
| Period | 2026 data | Calendar 2022 |
So the practical rule is to pick the benchmark that measures what you measure. If your churn is subscriber-based and annual, use the Recurly table. If you track gross revenue retention, use ChartMogul's definition and bands. Quoting one against the other is how a "good" number turns into a "terrible" one.
Worked example: compare your churn with the right row
Sample data: a subscription product with an average revenue per customer of $40, 4,000 subscribers at the start of the year and 520 of them gone by year end: 360 cancelled and 160 lost to failed payments. Subscribers who joined during the year are excluded from the count, because they were not in the starting group.
- Total annual churn: 520 ÷ 4,000 = 13.0%
- Voluntary: 360 ÷ 4,000 = 9.0%
- Involuntary: 160 ÷ 4,000 = 4.0%
- Monthly equivalent: 1 − (1 − 0.13)^(1/12) = 1.15% a month
Against the $25 to $50 band (3.84% total, 2.73% voluntary, 1.11% involuntary), the product is 3.4 times the median in total, 3.3 times on voluntary and 3.6 times on involuntary. That is far above, but not yet a verdict. Walk the checks in order:
- Same period? Annual against annual. If your figure was a one-month rate, convert it first.
- Same denominator? Subscribers at the start of the year, not the average or the end count.
- Same unit? Subscribers, not revenue.
- Same plan size? Here yes, $40 falls in the $25 to $50 band.
- Is the sample comparable? A new product with a first-year cohort churns differently from a mature book.
If all five hold, the gap is real, and the split says where to work: involuntary churn at 4.0% against 1.11% points to payment recovery (card updates, retries, reminders), which is usually the cheapest to fix; voluntary churn at 9.0% against 2.73% points to product value and onboarding. If you are instead tracking revenue retention, the same example's 13% revenue churn would put you well inside ChartMogul's 30% to 40% top-quartile range for low-price plans, which is why the definition comes first.
What should you do once you know where you stand?
Turn the comparison into an action with a simple rule of thumb (ours, not a published standard), applied after the five checks above pass:
| Your churn against the matching median | What it suggests | First move |
|---|---|---|
| Up to 1.5 times | Normal range | Watch the trend each quarter |
| 1.5 to 2 times | Worth a look | Split voluntary and involuntary, then act on the larger gap |
| More than 2 times | Likely a real problem, or a definition mismatch | Re-run the five checks, then work on the biggest component |
| Below the median | Good, but check the sample | Confirm you are not excluding customers who left early |
In the example, 13.0% against 3.84% is 3.4 times, so it lands in the last band of the problem rows. The involuntary split is also 3.6 times, which makes failed-payment recovery the first thing to examine because it is the component that needs no change to the product.
How can you track churn in TapCub?
TapCub does not read your billing or payments, so it cannot calculate subscriber churn or involuntary churn; those come from your billing system. What it can measure is activity churn: people who were active and then stopped. That is an early signal worth comparing with your billing churn.
- Identify logged-in users. Lifecycle counts people, so call
tapcub.loginso that logins are linked to one person. Anonymous visitors have no profile. - Open Lifecycle. In All-platform analytics › Behavior › Behavior analysis, choose the lifecycle view, set the period to month and, if you want, the core action that counts as activity.
- Read the four counts. For each period you see New, Returning, Resurrecting and Dormant. Dormant is drawn on the next period as a negative: people active in this period and absent in the next. The current unfinished period is not marked dormant.
- Compute the rate. Our own formula: activity churn for a period = dormant people ÷ people active in that period (New + Returning + Resurrecting). For example, with 1,000 active people (150 new, 780 returning, 70 resurrecting) and 90 dormant in the next period, activity churn is 90 ÷ 1,000 = 9.0%.
- Check retention by cohort. In the same menu, the retention view shows the share of each cohort active in later periods, with the size-weighted average underneath.
Retention is unavailable under strict privacy mode because the salt changes daily. And the billing side stays in your payment system: TapCub does not do payments or dunning.
What are the common mistakes with churn benchmarks?
- Mixing monthly and annual. 2% monthly is about 21.5% annual, not 24%.
- Mixing subscribers and revenue. The two sources above differ by about ten times partly for this reason.
- Using the industry row for a different price. Plan size moves churn more than the industry label does.
- Counting new joiners in the denominator. Use the subscribers you had at the start.
- Ignoring the voluntary and involuntary split. The fixes are different, and the split is the first thing to compute.
FAQ
What is a good churn rate by industry?
On Recurly's July 2026 medians, annual churn runs from 3.22% for SaaS to 4.99% for education, and 3.60% across all industries. Recurly also describes below 2% annual as strong performance. These are subscriber-based annual rates.
Is 5% churn good or bad?
It depends on the period. 5% annual is near the top of Recurly's industry range. 5% monthly is 45.96% a year, which is very high on any subscriber basis.
What is the difference between voluntary and involuntary churn?
Voluntary churn is a customer choosing to cancel. Involuntary churn is a customer losing access because a payment failed. In Recurly's data, involuntary churn is 1.06% to 1.69% a year across industries.
Why do churn benchmarks differ so much between sources?
They measure different things: subscribers or revenue, median or top quartile, annual or monthly, different populations and years. Compare yours only with a benchmark that defines churn the way you do.
How do I convert monthly churn to annual churn?
Annual churn = 1 − (1 − monthly churn)^12. A monthly 1% gives 11.36% a year, and 3% gives 30.62%.
Sources
Was this article helpful?
We use your answers to fix and expand this page.
Couldn’t send. Please try again in a minute.
Thanks for the feedback. We’ll use it to improve this page.You’ve already sent feedback on this page. Thanks.

Customer Experience Consultant
Writes about live chat, visitor conversations, and self-service, sharing practical ways to make customer communication clearer and more effective.