Try it on your own data
Every report in this article is in the free plan. One snippet for web and apps, up to 10 sites.
Start freeTo calculate churn rate, divide the customers you lost during a period by the customers you had at the start, then multiply by 100. Revenue churn uses recurring revenue instead, so the same month can read 4.0% by customers, 3.0% by gross revenue and 0.2% by net revenue. State which one you mean and keep the denominator fixed.
What you will learn
- Customer churn = lost ÷ customers at the start; leave out people who joined during the period
- Gross revenue churn counts losses only; net revenue churn subtracts expansion and can be negative
- Do not multiply monthly churn by 12: 4.0% a month is 38.7% a year, not 48%
Two churn rates, and why the denominator matters
Churn rate is the share of what you had at the start of a period that you lost by the end of it. "What you had" can be customers or it can be recurring revenue, and the two give different answers for the same business. Add a third choice, which period you divide over, and the same company can report a churn of 3%, 4% or 38%, all of them correct for their own definition.
| Rate | Formula | Counts | Can it be negative? |
|---|---|---|---|
| Customer (logo) churn | customers lost in the period ÷ customers at the start | People or accounts | No |
| Gross revenue churn | (churned MRR + contraction MRR) ÷ MRR at the start | Revenue lost from existing customers | No |
| Net revenue churn | (churned + contraction − expansion MRR) ÷ MRR at the start | Revenue lost minus revenue gained from existing customers | Yes |
| Retention rate | 1 − churn rate | The share kept | — |
MRR is monthly recurring revenue. Contraction is revenue lost when a customer stays but pays less, such as a downgrade; expansion is the opposite, revenue gained from an existing customer through an upgrade or extra seats. The point of this article is that you need to pick the right row for the question you are asking, and then keep the same denominator every time.
For how churn relates to its mirror image, see churn rate vs retention rate, and for the definitions see churn and revenue churn.
| Rate | Formula | Can it be negative? |
|---|---|---|
| Customer churn | customers lost ÷ customers at start | No |
| Gross revenue churn | (churned + contraction MRR) ÷ starting MRR | No |
| Net revenue churn | (churned + contraction − expansion MRR) ÷ starting MRR | Yes |
| Retention rate | 1 − churn rate | — |
MRR is monthly recurring revenue; contraction is downgrades, expansion is upgrades and extra seats.
How to calculate customer churn rate, step by step
Stripe states the formula as customers lost during the period divided by customers at the start of the period, times 100. Its example: a company starts a quarter with 200 customers and loses 10, so churn is 10 ÷ 200 = 5% for the quarter.
- Choose the period. Monthly is the most common. Quarterly and annual work too, but you cannot compare a quarterly rate with a monthly one.
- Count the customers at the start of the period. This is your denominator. Use a fixed rule for what makes someone a customer: a paid subscription that is active on that date.
- Count how many of those same customers were lost by the end of the period. Define "lost" once: cancelled, or expired and not renewed, or unpaid for some number of days.
- Divide the lost by the start count.
- Leave out customers who joined during the period. They are not in the starting count, so they should not be in the numerator either. If someone signs up on the 5th and cancels on the 20th, they belong to the next period's starting base, or to a separate "early churn" figure.
How to calculate revenue churn, gross and net
Customer churn treats every customer as one. Revenue churn weights them by what they pay, which is why the two diverge when the people who leave are small accounts, or when big accounts shrink without leaving.
ChartMogul's help pages give the standard definitions. Gross MRR churn is churned plus contraction MRR, divided by MRR at the start of the period; it counts only lost revenue, so it can never be negative. Net MRR churn subtracts expansion and reactivation MRR from that loss before dividing; it can be negative when upgrades from existing customers exceed what you lost.
Read them together:
- Gross revenue churn says how leaky the base is, whatever else happens.
- Net revenue churn says whether the base grows or shrinks on its own, without new customers.
A business with net revenue churn below zero is growing revenue from existing customers alone. That is a healthy sign, but it can hide a gross churn that is still high.
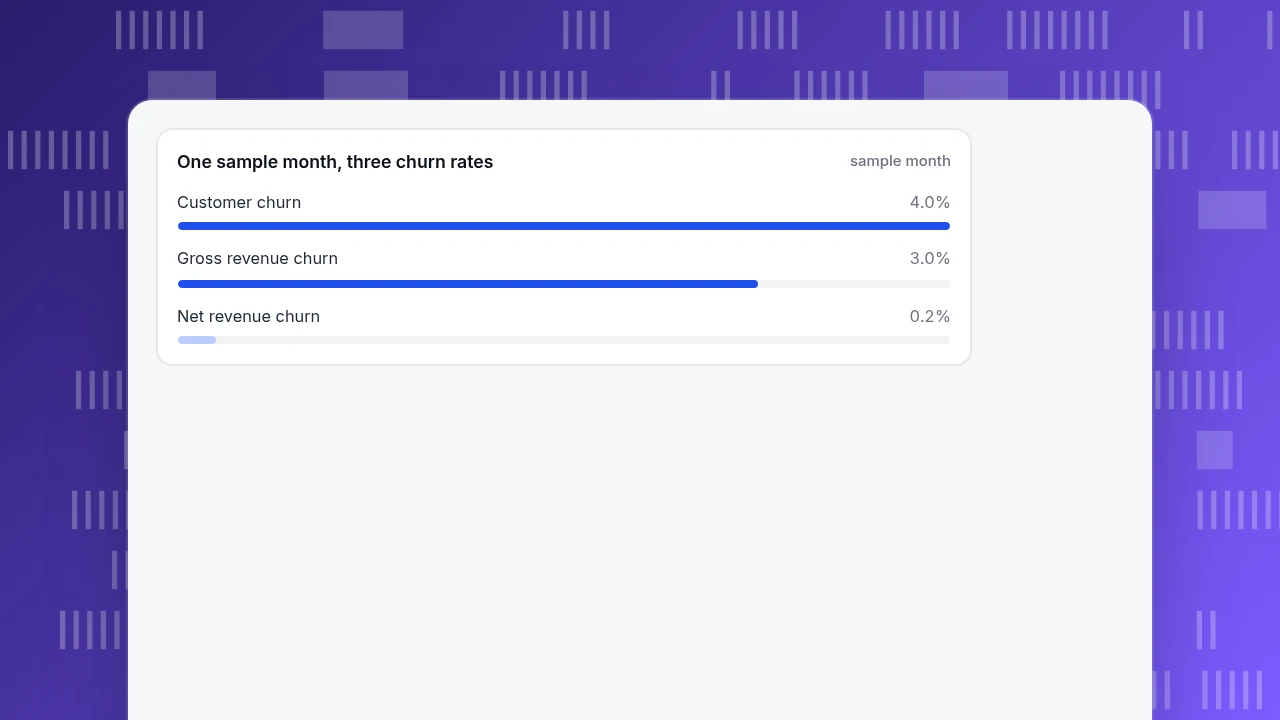
Worked example: one month, three churn rates
Sample data: a subscription business starts the month with 1,000 customers and $50,000 of MRR. During the month:
- 120 new customers join (they are not in the starting base).
- 40 of the starting customers cancel. They paid $900 of MRR together, an average of $22.50 each; they were small accounts.
- Other customers downgrade, losing $600 of MRR (contraction).
- Other customers upgrade, adding $1,400 of MRR (expansion).
| Measure | Calculation | Result |
|---|---|---|
| Customer churn | 40 ÷ 1,000 | 4.0% |
| Gross revenue churn | (900 + 600) ÷ 50,000 | 3.0% |
| Net revenue churn | (900 + 600 − 1,400) ÷ 50,000 | 0.2% |
The same month is "4% churn", "3% churn" or "0.2% churn", depending on what you measure. The customer figure is higher than the revenue figure because the people who left were small. The net figure is close to zero because upgrades nearly cancelled the loss. If expansion had been $1,800 instead of $1,400, net revenue churn would be (1,500 − 1,800) ÷ 50,000 = −0.6%, which is negative churn.
None of these is wrong. They answer different questions: how many people did we lose (customer churn), how much recurring revenue leaked (gross), and is the existing base growing or shrinking (net). Decide which question you are asking before you quote a number.
One sample month, three churn rates
sample monthThe denominator mistakes that change the answer
Using the wrong denominator is the most common way to get a churn number that no one can reproduce.
- Dividing by customers at the end of the period. For the example, that is 1,000 + 120 − 40 = 1,080, and 40 ÷ 1,080 = 3.7% instead of 4.0%. The end count includes people who joined during the month and were never at risk of being counted in the numerator.
- Counting people who joined and left in the same period in the lost number, while leaving them out of the starting number. The rate is overstated.
- Averaging the start and end counts without saying so. It is a legitimate choice, but it gives a different number from the start-count method, so state which one you use.
- Mixing customer and revenue numbers, for example dividing lost MRR by the customer count.
- Changing the definition of "lost" partway through a year, so a drop in churn is partly a change in wording.
Pick one method, write it down, and use it for every period.
Annualising: do not multiply by twelve
A monthly churn rate of 4.0% does not mean 48% a year. Customers lost in January are not available to be lost in February, so the monthly losses compound on a shrinking base:
Annual churn = 1 − (1 − monthly churn)^12 = 1 − 0.96^12 = 38.7%.
Multiplying gives 4.0% × 12 = 48%, an overstatement of nearly ten points. The same applies to revenue: 3.0% gross revenue churn a month is 1 − 0.97^12 = 30.6% a year.
This formula assumes the monthly rate is steady, which is rarely exactly true. For reporting a real year, count the customers at the start of the year and how many of them were gone by the end, which is the first method applied to a 12-month period.
What is a typical churn rate for a SaaS company?
You will see many numbers, and they do not agree. Paddle's roundup of published benchmarks shows why. It cites Recurly data for SaaS with a monthly average of 4.8% and quartiles of 2.9% and 8.5%, from a sample of more than 1,500 subscription companies in 2018. It reports that average monthly revenue churn across studies ranges from about 1% to 17%, with most studies giving a median of 5% to 10%. By price point it gives a range of 3% to 16% (median 6% to 9%) for plans under $100 a month, and 2% to 6% (median 3% to 4%) above $500.
Three cautions apply. The datasets differ in age, size and who was included. Definitions differ: some figures are customer churn, some revenue churn, some monthly, some annual. And plan price matters, since cheap, self-serve plans churn faster than expensive, contracted ones. Compare your own churn with your own earlier months and between your own segments first. Use a published average only as a rough range, and only after checking that its definition matches yours.
Common mistakes
- Quoting "churn" without saying customer or revenue, and which period.
- Dividing by the end count or by an average without saying so.
- Counting same-period joiners in the lost number.
- Multiplying a monthly rate by twelve.
- Treating net revenue churn as the whole story. A low net figure can hide a high gross figure that expansion is covering.
- Ignoring segments. One blended rate hides that small accounts leave faster than large ones.
- Judging a churn change over a short window with a few dozen customers; one cancellation moves the percentage a lot.
- Treating inactivity as churn without checking that billing agrees.
In TapCub: use behaviour to see churn coming, billing to measure it
Take the example: 1,000 customers at the start, 40 cancel. The churn figure itself comes from your billing system, because that is where cancellations and MRR are recorded. TapCub does not read billing, collect payments or calculate subscription churn; it measures what customers do in your product and site, which tends to move before cancellations.
- Read retention by cohort. In All-platform analytics › Behavior › Behavior analysis, open retention and set the start event to sign-up and the return event to a key action. Each row is a cohort with a rate per period, so you can see whether the curve flattens or keeps falling.
- Read lifecycle. In the same menu, the lifecycle view counts new, returning, resurrecting and dormant users per week or month. Dormant is drawn on the next period as a negative: active now, absent next period. It is an activity measure, not a cancellation count.
- Split by segment. Use All-platform analytics › Users › Segments & tags to define a group such as users on one plan or from one source, and compare their retention. This is how you see the small-account pattern from the example.
- Compare activity with billing. Take the people billing marks as cancelled, and look at their activity in the 30 days before. If most stopped using the product weeks earlier, "inactive for 21 days" is a usable early warning list.
- Send the cancellation fact itself from your server as an event if you want to analyse behaviour before cancelling: the order ID or account ID makes it a repeat-safe key, as in ecommerce integration.
TapCub does not send win-back messages or change plans; it tells you who is slipping and from where.
FAQ
How do you calculate churn rate?
Divide the customers you lost during the period by the customers you had at the start of the period, then multiply by 100. For example, losing 40 of 1,000 customers in a month is 4.0% monthly churn. Leave out customers who joined during the period.
What is the difference between customer churn and revenue churn?
Customer churn counts people or accounts lost. Revenue churn counts recurring revenue lost, so a large account that leaves counts more than a small one. Gross revenue churn includes cancellations and downgrades; net revenue churn also subtracts expansion revenue from existing customers and can be negative.
What is the average churn rate for SaaS?
Published figures vary widely: monthly averages in roundups range from about 1% to 17%, and one Recurly-based figure is 4.8% a month. Definitions, company size and plan price all differ, so use an average only as a rough range, and compare with your own history first.
How do you convert monthly churn to annual churn?
Compound it: annual churn = 1 − (1 − monthly churn)^12. A 4% monthly rate gives 1 − 0.96^12 = 38.7% a year, not 48%. This assumes a steady rate; for a real year, count customers at the start of the year and how many were gone at the end.
Can churn rate be negative?
Net revenue churn can be negative, when expansion revenue from existing customers is larger than the revenue lost to cancellations and downgrades. Customer churn and gross revenue churn cannot be negative, since they count only losses.
See also: Average SaaS Churn Rate: Benchmarks by Contract Size.
See also: Churn Rate by Industry: Benchmarks and How to Compare Yours.
Sources
- Stripe, How to calculate churn rates (customer churn formula; 200 customers and 10 lost is 5% for the quarter). Checked 2026-11-19.
- ChartMogul Help Center, Gross MRR churn rate and Net MRR churn rate (formulas; gross can never be negative, net can). Checked 2026-11-19.
- Paddle, Average revenue churn rate benchmarks (benchmarks and datasets quoted above; Recurly data from 2018). Checked 2026-11-19.
Was this article helpful?
We use your answers to fix and expand this page.
Couldn’t send. Please try again in a minute.
Thanks for the feedback. We’ll use it to improve this page.You’ve already sent feedback on this page. Thanks.

Product Analyst
Focuses on event analysis, conversion funnels, and retention, using clear metric definitions and structured analysis to explain product performance.