Try it on your own data
Every report in this article is in the free plan. One snippet for web and apps, up to 10 sites.
Start freeGrowth rate = (ending value − starting value) ÷ starting value × 100, so 10,000 sessions rising to 14,500 is 45%. Over several periods there are three methods: simple, period-over-period and compound. Picking the wrong one overstates or understates growth. In the example below, averaging monthly rates overstates June by 150 sessions.
What you will learn
- Simple growth compares end with start; compound growth is the steady per-period rate that reaches the end
- Averaging monthly rates overstates growth whenever rates bounce: 7.94% against a true 7.71% in the example
- Use MoM for momentum, YoY for seasonal businesses, and label any annualized figure as an if, not a forecast
What is a growth rate, and which formula do you need?
A growth rate is the change in a number between two points in time, shown as a percentage of where it started. The basic formula is:
Growth rate = (ending value − starting value) ÷ starting value × 100
If monthly sessions go from 10,000 to 14,500, the growth is (14,500 − 10,000) ÷ 10,000 = 45%. That is the simple growth rate, and it answers "how much bigger is it now than it was then?"
The trouble starts when the span covers several periods. People then reach for three different calculations that give three different answers:
- Simple growth: end versus start, ignoring everything in between.
- Period-over-period growth: each period against the one before it, such as month-over-month or year-over-year.
- Compound growth: the single constant rate per period that would take you from start to end.
This guide runs all three on the same six months of data so you can see where they agree and where they do not. Choose the wrong one and you will overstate or understate growth, usually in the direction that flatters the chart. The monthly compound version has its own page, compound monthly growth rate; revenue specifically is covered in revenue growth rate.
The growth rate formulas at a glance
| Type | Formula | Answers | Use it when |
|---|---|---|---|
| Simple growth | (End − Start) ÷ Start | How much has it grown in total? | Two points, one period |
| Month-over-month (MoM) | (This month − Last month) ÷ Last month | How did this month do against the last? | Tracking recent momentum |
| Year-over-year (YoY) | (This period − Same period last year) ÷ Same period last year | Is it growing after removing seasons? | Seasonal businesses |
| Average growth rate | Sum of period rates ÷ number of periods | What was the typical period? | Only as a rough descriptor |
| Compound growth rate | (End ÷ Start)^(1 ÷ n) − 1 | What steady rate gets you from start to end? | Several periods, comparing trends, projecting |
| Annualized rate | (End ÷ Start)^(periods per year ÷ n) − 1 | What if this pace lasted a year? | Comparing spans of different length |
Here n is the number of intervals between the first and last value: six monthly values have five intervals. The definitions of the period-over-period versions are in the glossary: month-over-month, year-over-year and annual growth rate.
Worked example: six months, three answers
Sample data: monthly sessions for a website.
| Month | Sessions | MoM growth |
|---|---|---|
| Jan | 10,000 | n/a |
| Feb | 11,000 | +10.0% |
| Mar | 10,450 | −5.0% |
| Apr | 12,000 | +14.8% |
| May | 13,200 | +10.0% |
| Jun | 14,500 | +9.8% |
Each MoM figure is (this month − last month) ÷ last month; for April, (12,000 − 10,450) ÷ 10,450 = 14.83%. There are five intervals (n = 5).
Simple growth, January to June: (14,500 − 10,000) ÷ 10,000 = 45.0%.
Average of the monthly rates: (10.0 − 5.0 + 14.83 + 10.0 + 9.85) ÷ 5 = 7.94% per month.
Compound monthly growth rate (CMGR): (14,500 ÷ 10,000)^(1/5) − 1 = 1.45^0.2 − 1 = 7.71% per month.
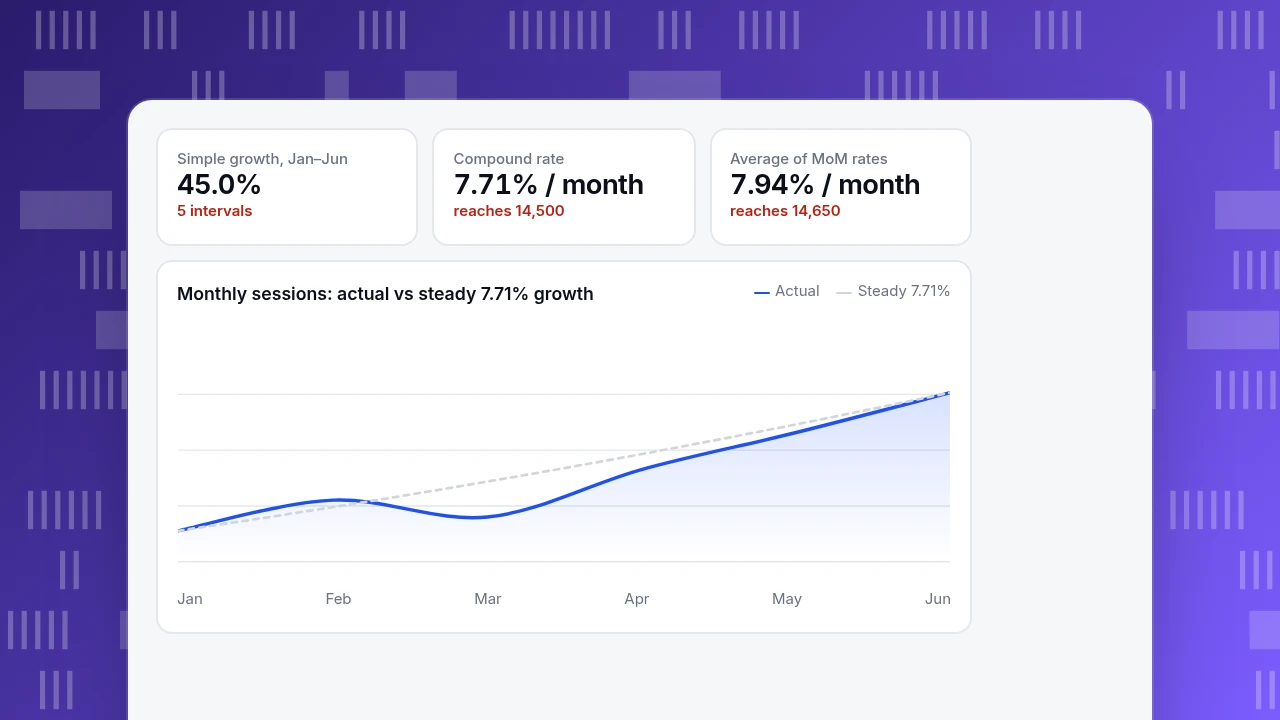
Now test them. A constant 7.71% a month for five months does reach the end: 10,000 × 1.0771^5 = 14,500. The 7.94% average does not: 10,000 × 1.0794^5 = 14,650, which overstates June by 150 sessions (1.0%). The average of monthly rates is a little too high whenever the rates bounce around, because a −5% month costs more than its size suggests. That is why compound growth, not the average, is the number to quote for a trend.
Annualized: if the six-month pace of 7.71% a month continued for 12 months, sessions would grow by 1.45^(12/5) − 1 = 143.9%. That is an if, not a forecast.
Simple growth, Jan–Jun
45.0%
5 intervals
Compound rate
7.71% / month
reaches 14,500
Average of MoM rates
7.94% / month
reaches 14,650
Monthly sessions: actual vs steady 7.71% growth
ActualSteady 7.71%Which calculation should you use?
Pick by what you will do with the number:
- Two points, report the change: simple growth. "Sessions are up 45% since January."
- Describe one month against the last: month-over-month. Good for momentum, noisy for trends (one −5% month in the example).
- Seasonal business or a holiday in the period: year-over-year, comparing the same month last year.
- Compare channels or periods of different length, or project forward: compound rate, then annualize if you need a common basis.
- Never report the average of monthly rates as the trend. Use it only as a descriptive "typical month" and say so.
A rule of thumb: if the rates in your series all have the same sign and similar size, the average and compound rates will be close; when the series bounces, they diverge and the compound is the correct one. Check with the test above: apply the rate five times and see whether you land on the end value.
| Situation | Use | Watch out for |
|---|---|---|
| Two points in time | Simple growth | Say the period; 45% over five months is 7.7% a month |
| Month against the last | Month-over-month | Noisy; one bad month can hide a trend |
| Seasonal business | Year-over-year | Needs the same period last year |
| Several periods, comparing trends | Compound rate: (end ÷ start)^(1 ÷ n) − 1 | n is intervals, not values |
| Spans of different length | Annualized rate | An if, not a forecast; avoid annualizing one month |
| Series starting at zero or negative | Change in absolute units | The percentage cannot be computed or misleads |
Check any rate by applying it n times and seeing whether you reach the end value.
Month-over-month or year-over-year?
The two answer different questions, and mixing them is how a good year gets reported as a bad month.
Take June at 14,500 sessions. Against May (13,200), MoM growth is 9.8%. If June last year was 11,600, YoY growth is (14,500 − 11,600) ÷ 11,600 = 25.0%. Both are true. MoM tells you momentum from the last month; YoY tells you the direction after removing the seasonal pattern, because June is compared with a June.
Use MoM for operations (is this week's change real?) and YoY for strategy (are we really bigger than last year?). In a business with strong seasons, a MoM figure around a peak or a trough tells you about the calendar, not the business.
Annualizing a short period
Growth over a quarter or a month is often restated as an annual rate so spans of different length can be compared. The U.S. Bureau of Economic Analysis publishes most quarterly changes at annual rates and uses the compound formula: annual rate = ((level in quarter 2 ÷ level in quarter 1)^4 − 1) × 100. Its own example: real GDP of $10,597.1 billion in Q4 2003 against $10,493.1 billion in Q3 gives 1.009911, raised to the fourth power is 1.040237, so growth was about 4.0% at an annual rate. BEA describes this as what the change would be if the quarter's pace continued for a full year.
Two cautions that follow from that definition:
- It is an "if", not a forecast. A 5% quarter becomes 1.05^4 − 1 = 21.6% annualized; the next quarter will not necessarily repeat it.
- Short, small periods exaggerate. A single noisy month annualized with the exponent 12 gives a huge number. Annualize from at least a quarter, and say how many periods you used.
Edge cases that break the formula
- Starting value of zero. Dividing by zero is not possible. Say "from zero to 40" or use the change in absolute units instead.
- Negative starting values. A swing from −20 to −10 is an improvement, but the formula gives (−10 − (−20)) ÷ (−20) = −50%; avoid growth rates for series that start negative or cross zero.
- Percent versus percentage points. If a conversion rate moves from 2.0% to 3.0%, that is 1 percentage point, or 50% growth. Say which.
- Gains and losses are not symmetric. A rise from 100 to 150 is +50%; the fall back from 150 to 100 is −33.3%, not −50%. Percentages compound.
- Different bases. Comparing the growth of a small channel (200 to 400, +100%) with a large one (20,000 to 22,000, +10%) says little; show the change in absolute units beside the rate.
- Partial periods. Do not compare the current month-to-date with a full previous month.
Common mistakes
- Averaging monthly rates and calling it a trend. In the example it overstated June by 150 sessions.
- Mixing MoM and YoY in the same sentence or chart.
- Annualizing one month and presenting the result as a forecast.
- Quoting the percentage without the base. "Up 100%" from 20 to 40 is not the same news as 20,000 to 40,000.
- Comparing different numbers of periods without converting to a per-period rate.
- Forgetting to say the period: "growth of 45%" over five months is 7.7% a month.
Growth rates in TapCub
Take the six months above and check them against your own traffic:
- Open All-platform analytics › Behavior › Event analysis and pick the event, such as pageviews or a goal. Switch the view to trend, table or number.
- Set the compare period: previous period or same period last year. Trend and number default to the previous period, which can align weekdays; "same period last year" gives you the YoY view without any arithmetic.
- In Web analytics › Overview, use the header's compare option for the same two periods across the core metrics. When your range includes today, the comparison stops at the same time of day, so a partial day is not set against a full one.
- For the compound rate across several months, read the monthly totals from the table and apply the formula above, or use the growth rate calculator. TapCub's comparison gives the change between two periods; the five-interval compound rate is a calculation you do from those totals.
TapCub measures what happened; it does not forecast. When you annualize, label it as the pace "if it continued".
FAQ
How do you calculate growth rate?
Subtract the starting value from the ending value, divide by the starting value, and multiply by 100. From 10,000 to 14,500 sessions: (14,500 − 10,000) ÷ 10,000 × 100 = 45%. For several periods, use the compound rate instead.
What is the difference between simple and compound growth?
Simple growth compares only the end with the start. Compound growth is the steady per-period rate that gets from start to end: (end ÷ start)^(1 ÷ n) − 1. In the example, 45% in total is 7.71% a month compounded.
How do you calculate growth rate over multiple periods?
Use (end ÷ start)^(1 ÷ n) − 1, where n is the number of intervals, not the number of values. Six monthly values have five intervals. Check it by applying the rate n times and seeing whether you land on the end value.
What is a good growth rate?
It depends on the base, the market and the period; there is no single number. Compare your rate with your own past and with a stated target, and quote the period and base alongside it.
Why is average growth different from compound growth?
Percentages multiply, not add. When monthly rates bounce, their average is higher than the constant rate that reaches the same end value. In the example, 7.94% versus 7.71%, which overstates June by 150 sessions.
Sources
Was this article helpful?
We use your answers to fix and expand this page.
Couldn’t send. Please try again in a minute.
Thanks for the feedback. We’ll use it to improve this page.You’ve already sent feedback on this page. Thanks.

Product Adoption Consultant
Explores customer onboarding, live conversations, and self-service, turning common usage questions into practical guidance and improvements.