Try it on your own data
Every report in this article is in the free plan. One snippet for web and apps, up to 10 sites.
Start freeMonthly growth swings up and down, which makes it hard to compare. Compound monthly growth rate turns a period into one steady rate. This guide gives the formula, works through a 12-month MRR example, and shows why the average of monthly growth rates overstates growth.
What you will learn
- CMGR = (end ÷ start) ^ (1 ÷ months) − 1, where months counts the steps between the two values
- Averaging month-over-month rates overstates growth when months swing up and down
- Say which window you used (CMGR3, CMGR6, CMGR12) and use full months
What is compound monthly growth rate?
Compound monthly growth rate (CMGR) is the single monthly rate that, applied every month, takes a metric from its starting value to its ending value. It smooths out good and bad months into one number you can compare across periods, products or companies.
Startups and investors use it for monthly recurring revenue, active users and orders, because "we grew 7% a month for a year" is easier to compare than twelve separate month-over-month numbers.
The formula
CMGR = (ending value ÷ starting value) ^ (1 ÷ number of months) − 1"Number of months" is the number of monthly steps between the two values, not the number of data points. January to December is 11 steps; January to the next January is 12.
A worked example
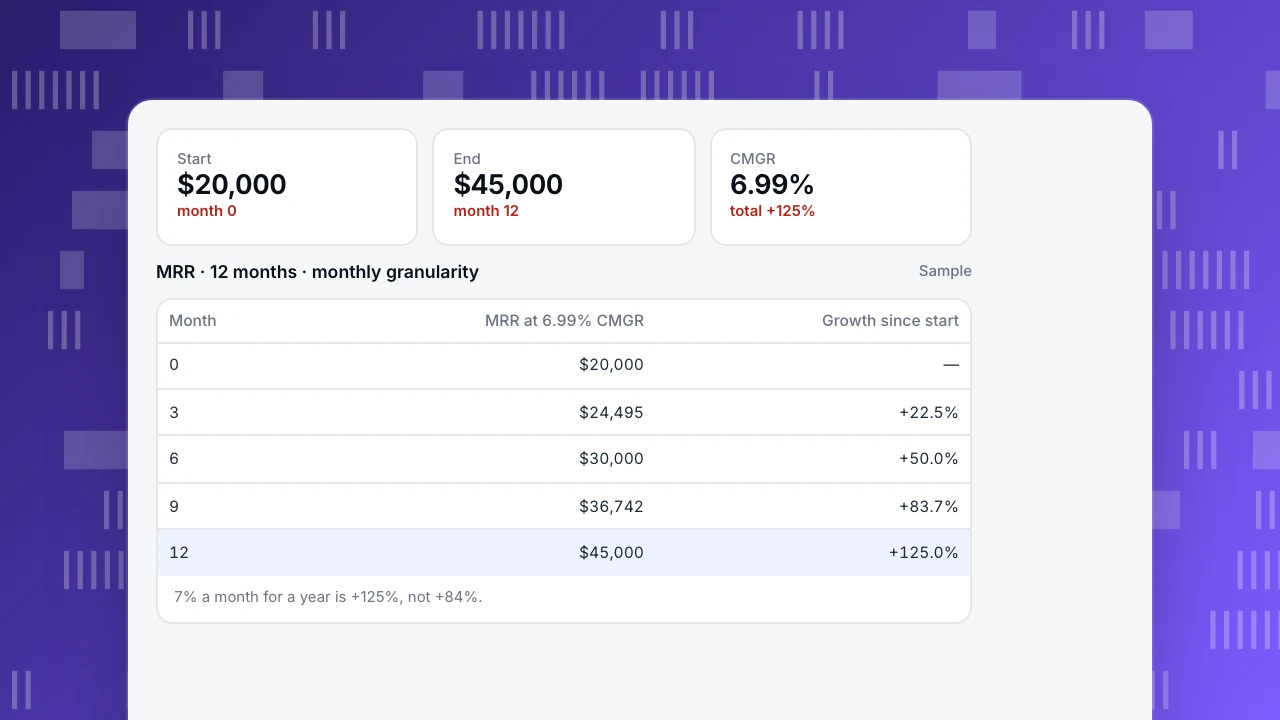
A SaaS company's MRR goes from $20,000 to $45,000 over 12 months (sample numbers).
- Ratio: 45,000 ÷ 20,000 = 2.25
- 12th root: 2.25 ^ (1/12) ≈ 1.0699
- CMGR ≈ 6.99%, roughly 7% a month
Check it: $20,000 × 1.0699 for six months gives $30,000, and for twelve months $45,000. The total growth is 125%, which is not 12 × 7% = 84%. Compounding is why the two differ.
Start
$20,000
month 0
End
$45,000
month 12
CMGR
6.99%
total +125%
MRR · 12 months · monthly granularity
Sample| Month | MRR at 6.99% CMGR | Growth since start |
|---|---|---|
| 0 | $20,000 | — |
| 3 | $24,495 | +22.5% |
| 6 | $30,000 | +50.0% |
| 9 | $36,742 | +83.7% |
| 12 | $45,000 | +125.0% |
7% a month for a year is +125%, not +84%.
Why not average the monthly growth rates?
Take four months of sign-ups: 10,000, 15,000, 12,000, 18,000 (sample numbers).
- Month-over-month changes: +50%, −20%, +50%
- Simple average: 26.7% per month
- CMGR: (18,000 ÷ 10,000) ^ (1/3) − 1 = 21.6% per month
Grow 10,000 by 26.7% three times and you get about 20,323, more than you actually reached. Grow it by 21.6% three times and you get 18,000, the real number. The simple average overstates growth whenever months swing up and down, because a 20% drop needs a 25% rise just to get back.
CMGR vs month-over-month vs CAGR
The table below compares the three. Use month-over-month to spot what changed this month, CMGR to describe the trend, and CAGR for multi-year comparisons.
| Month-over-month (MoM) | CMGR | CAGR | |
|---|---|---|---|
| Measures | Change from last month | Steady monthly rate over a period | Steady yearly rate over several years |
| Formula | this ÷ last − 1 | (end ÷ start)^(1/months) − 1 | (end ÷ start)^(1/years) − 1 |
| Good for | Spotting what changed this month | Describing the trend, comparing periods | Long-term comparisons |
| Weakness | Noisy; one bad month dominates | Ignores the path between start and end | Too slow for early-stage startups |
CMGR only uses the first and last values, so always look at the monthly chart as well.
CMGR3, CMGR6, CMGR12
Investors often ask for CMGR over a fixed window. CMGR3 (last three months) shows current momentum and moves quickly. CMGR12 shows the year's trend and hides short bumps. Report the window you used. Two practical rules:
- Use full months. A partial current month makes growth look lower.
- Check for seasonality. A December peak at the end of the window makes CMGR look higher than it really is.
How to calculate it in a spreadsheet
With monthly values in B2 (first month) to B14 (thirteenth month, 12 steps later):
=(B14/B2)^(1/12)-1Or, with the number of steps counted automatically:
=(B14/B2)^(1/(ROWS(B2:B14)-1))-1Format the cell as a percentage.
Getting monthly values from TapCub
In All-platform analytics, set the granularity of a trend or event analysis to month and read the first and last full month: active users, sign-up events, or a purchase event summed by amount. For recurring revenue, use your billing system as the source of truth and see MRR and ARR. Then put the monthly values into the formula above.
See also: Exponential growth, Revenue growth rate.
Was this article helpful?
We use your answers to fix and expand this page.
Couldn’t send. Please try again in a minute.
Thanks for the feedback. We’ll use it to improve this page.You’ve already sent feedback on this page. Thanks.

Data Engineer
Writes about event design, data quality, and collection workflows, with verifiable implementation methods for reliable analytics.