Try it on your own data
Every report in this article is in the free plan. One snippet for web and apps, up to 10 sites.
Start freeTo calculate incrementality, randomly split an audience into a test group and a holdout group, then compute (test rate − holdout rate) ÷ holdout rate. A before-and-after comparison cannot do this, because season and other campaigns move conversion too. In the sample, 2.70% against 2.30% is a 17.4% lift and 360 extra conversions.
What you will learn
- Incremental lift = (test rate − holdout rate) ÷ holdout rate; dividing by the test rate gives a different number, the incremental share
- A holdout, not a before-and-after, isolates the campaign: a 10% market rise turns a 17.4% lift into 29.1%
- Report a range: a 1,000-person holdout cannot tell a good campaign from none
The incrementality formula, and the two ways people write it
Incrementality measures how many conversions happened because of a campaign and would not have happened without it. To calculate it, you split an audience at random into a test group that sees the campaign and a holdout (control) group that does not, then compare their conversion rates. Google's help page on conversion lift describes the same design: a treatment group that sees the ads, a control group that does not, and the difference in conversions between them as the lift.
Three numbers come out of that comparison.
| Measure | Formula | What it answers |
|---|---|---|
| Incremental conversions | (test rate − holdout rate) × test group size | How many extra conversions did the campaign cause? |
| Incremental lift | (test rate − holdout rate) ÷ holdout rate | By what percent did the campaign raise conversion over the baseline? |
| Incremental share | (test rate − holdout rate) ÷ test rate | What share of test-group conversions would not have happened otherwise? |
The last two are the source of confusion. Guides that divide the gap by the test rate are calculating the share of test conversions the campaign caused. Guides that divide by the holdout rate are calculating lift over baseline. Both are correct; they answer different questions and give different percentages for the same data, so always state which one you mean. This article uses lift, (test − holdout) ÷ holdout, as the headline, and shows the share beside it.
Why before-and-after comparisons give the wrong answer
The tempting shortcut is to compare conversion before the campaign with conversion during it. It fails because other things change at the same time: season, pricing, a competitor's sale, a news event, your own other campaigns. Everything that moves conversion gets credited to the campaign.
A holdout group solves this because it lives through the same weeks as the test group. Whatever the season does to one, it does to the other, so the difference between them isolates the campaign.
The sample later in this article shows how large the error can be: a market-wide 10% rise in conversion turns a true lift of 17.4% into an apparent lift of 29.1%. Observational methods can fail in the same way. In a study of 15 large advertising experiments at Facebook, published in Marketing Science in 2019, Gordon and colleagues compared the randomised results with common observational methods and found that the observational methods often failed to reproduce the experimental effects, even with extensive data on the people involved.
How to design the holdout so the result can be trusted
The calculation is simple. The design is where tests succeed or fail.
- Randomise people, not days. Assign each person to test or holdout at random, and keep them in that group for the whole test. Splitting by day or by region without care reintroduces the problem you are trying to avoid.
- Keep the holdout truly unexposed. If the holdout sees the same offer through another channel, such as a different ad network or an email, the gap shrinks. Pause overlapping campaigns for both groups or at least know about them.
- Decide the holdout size in advance. A small holdout gives a wide margin of error. See the table below.
- Fix the measurement window. Choose how long after exposure a conversion counts, for example 7 days, before you look at results.
- Define the conversion once. An order, a sign-up, a payment. Count it the same way in both groups.
- Run it long enough to cover normal weekly variation, usually at least one full week and often two.
- Do not peek and stop early. Decide the stopping rule beforehand.
Worked example: a 90 / 10 holdout test
Sample data: 100,000 people in the target audience. 90,000 are randomly assigned to see the campaign (test) and 10,000 are held out (holdout). The test ran for two weeks and conversions were counted in the same window for both groups.
| Group | People | Conversions | Conversion rate |
|---|---|---|---|
| Test | 90,000 | 2,430 | 2.70% |
| Holdout | 10,000 | 230 | 2.30% |
- Difference in rate: 2.70% − 2.30% = 0.40 percentage points.
- Incremental lift: 0.40 ÷ 2.30 = 17.4%.
- Incremental conversions: 0.40% × 90,000 = 360.
- Incremental share: 360 ÷ 2,430 = 14.8%, which equals 0.40 ÷ 2.70.
So the campaign caused about 360 of the 2,430 conversions in the test group. The other 2,070 would have happened anyway.
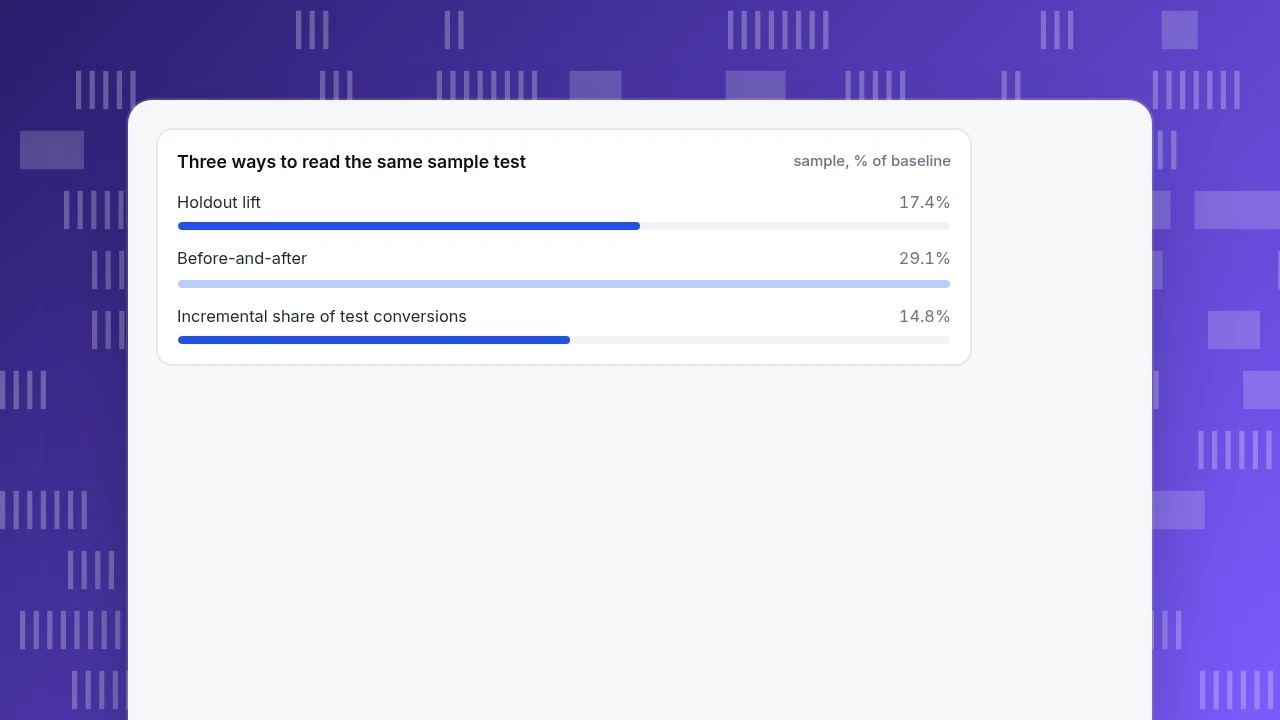
Now look at the before-and-after shortcut on the same numbers. Suppose the two weeks before the test had a conversion rate of 2.09%, and the market-wide rate rose by 10% over the test period (the holdout shows this: 2.09% × 1.10 = 2.30%). A before-and-after comparison would say: (2.70% − 2.09%) ÷ 2.09% = 29.1% lift. The holdout says 17.4%. The extra 11.7 points is the season, not the campaign.
Three ways to read the same sample test
sample, % of baselineTurn the lift into cost per extra conversion and return
Lift tells you the effect size. To decide whether the campaign paid, convert it to money.
Sample assumptions: the campaign cost $18,000 and each conversion is worth $80.
- Incremental cost per conversion: $18,000 ÷ 360 = $50.
- Incremental revenue: 360 × $80 = $28,800.
- Incremental return on spend: $28,800 ÷ $18,000 = 1.6.
Compare this with a number from attribution. Suppose an ad platform's report credits the campaign with 1,150 conversions. Then its reported cost per conversion is $18,000 ÷ 1,150 = $15.65, and its reported return is 1,150 × $80 ÷ $18,000 = 5.1. The holdout says the real figures are $50 and 1.6. The platform is counting people who would have converted anyway, which is the question incrementality exists to answer. Google's help page defines the same two derived metrics: incremental cost per acquisition (spend ÷ incremental conversions) and incremental return on ad spend (incremental conversion value ÷ spend).
Is the lift real, or just chance?
With a finite number of people, the observed gap has noise. Two standard checks tell you how much to trust it.
For the example, the pooled rate is (2,430 + 230) ÷ 100,000 = 2.66%, and the standard error of the difference is about 0.17 percentage points. The z-score is 0.40 ÷ 0.17 ≈ 2.4, so the result is statistically significant at the usual 95% level.
The margin of error depends mostly on the holdout size, because the holdout is the small group. Keeping the same rates and the same 90,000 test group, here is the 95% interval for the difference in rate at different holdout sizes:
| Holdout size | Holdout conversions | 95% interval for the difference | Interval for lift |
|---|---|---|---|
| 1,000 | 23 | −0.54 to +1.34 points | −23% to +58% |
| 2,500 | 58 | −0.20 to +1.00 points | −9% to +43% |
| 5,000 | 115 | −0.03 to +0.83 points | −1% to +36% |
| 10,000 | 230 | +0.09 to +0.71 points | +4% to +31% |
| 20,000 | 460 | +0.17 to +0.63 points | +7% to +28% |
A holdout of 1,000 people cannot tell a good campaign from no effect. Even at 10,000 the interval for lift runs from 4% to 31%. The point estimate of 17.4% is the middle, not a guarantee. Report the range with the number.
| Holdout size | 95% interval for lift |
|---|---|
| 1,000 | −23% to +58% |
| 2,500 | −9% to +43% |
| 5,000 | −1% to +36% |
| 10,000 | +4% to +31% |
| 20,000 | +7% to +28% |
Sample data: 2.70% test rate on 90,000 people, 2.30% holdout rate; the interval narrows as the holdout grows.
Where a holdout is not possible
Sometimes you cannot randomise people: a billboard, a TV spot, a sitewide change. The same logic applies at a different level. Compare comparable regions or time periods where one gets the campaign and the other does not, and use periods before the test to check that the two behaved similarly beforehand. Treat the result as weaker evidence than a randomised holdout and state what could differ between the groups.
Common mistakes
- Using before-and-after as a substitute for a holdout. Seasonality and other campaigns are credited to your campaign.
- Mixing up lift and share. (test − holdout) ÷ holdout and (test − holdout) ÷ test are different numbers.
- A holdout too small to read. A margin of error wider than the effect proves nothing.
- Letting the holdout see the offer through another channel.
- Changing the conversion definition or window between groups.
- Stopping the test the day the number looks good.
- Comparing exposed against unexposed people who were not randomised. People who see ads differ from people who do not; that is selection, not incrementality.
- Reporting one number without the range.
For the definitions, see the incrementality and holdout group glossary entries. For turning the result into a spend decision, read marketing ROI.
In TapCub: measure the two groups, not create them
Take the 90 / 10 test above. TapCub does not run experiments, split audiences, hold anyone out or deliver the campaign; it measures. You create the groups in the tool that sends the campaign, and TapCub counts what each group does.
- Assign and send the groups yourself, at random, in the email, ad or messaging tool that delivers the campaign. Keep the list of who is in each group.
- Send the group with the conversion. Add a property such as
holdout_groupwith the valuestestorcontrolto your conversion event, or attach it to the person. Send purchases from your server, as in ecommerce integration. - Break the conversion down by group. In All-platform analytics › Behavior › Behavior analysis, chart the conversion event with its unique people and break it down by that property. For the denominator, use the group sizes from step 1, because TapCub counts people who appear in your data, not people on your list.
- Do the arithmetic from this article on those counts: rates, lift, incremental conversions and the interval.
- Bring in the cost. If the campaign's spend is imported under All-platform analytics › Business › Channel ROI, you can see cost per acquisition there. Divide spend by the incremental conversions instead of by all conversions for the incremental figure.
Treat TapCub's own comparisons, such as visitors who chatted against visitors who did not, as observational: those groups are not randomised, so they do not measure incrementality.
FAQ
How do you calculate incrementality?
Randomly split an audience into a test group that gets the campaign and a holdout that does not. Compute each group's conversion rate over the same window. Incremental lift is (test rate − holdout rate) ÷ holdout rate, and incremental conversions are (test rate − holdout rate) × test group size.
What is the incrementality formula?
There are two common versions. Dividing the gap by the holdout rate gives lift over baseline. Dividing it by the test rate gives the share of test conversions that would not have happened without the campaign. They answer different questions, so say which one you report.
What is a good incrementality percentage?
There is no universal benchmark, because it depends on the channel, audience and conversion. A positive lift with a confidence interval that excludes zero means the campaign caused extra conversions. Whether it is worthwhile depends on incremental cost per conversion compared with what a conversion is worth.
How big should the holdout group be?
Large enough that the margin of error is smaller than the effect you care about. In the sample with a 2.3% base rate, a 1,000-person holdout cannot distinguish a good campaign from none, while 10,000 people give an interval of about 4% to 31% lift.
Can I measure incrementality without a holdout group?
Not reliably with before-and-after comparisons, which credit seasonality to the campaign. If you cannot randomise people, compare comparable regions or time periods where one gets the campaign, check they behaved alike beforehand, and treat the result as weaker evidence.
Sources
- Google Ads Help, About Conversion Lift (treatment and control groups; incremental CPA and incremental ROAS). Checked 2026-11-19.
- Gordon, Zettelmeyer, Bhargava and Chapsky, A Comparison of Approaches to Advertising Measurement: Evidence from Big Field Experiments at Facebook, Marketing Science 38(2), 2019. Checked 2026-11-19.
- TapCub docs, Event & property analysis (breakdown by property) and AARRR & ROI (cost import). Checked 2026-11-19.
Was this article helpful?
We use your answers to fix and expand this page.
Couldn’t send. Please try again in a minute.
Thanks for the feedback. We’ll use it to improve this page.You’ve already sent feedback on this page. Thanks.

Product Analyst
Focuses on event analysis, conversion funnels, and retention, using clear metric definitions and structured analysis to explain product performance.