Try it on your own data
Every report in this article is in the free plan. One snippet for web and apps, up to 10 sites.
Start freeTo calculate LTV, multiply profit per period by the number of periods a customer stays: for subscriptions, ARPA × gross margin ÷ churn rate. The catch is that revenue, margin, discounted and capped versions give different answers from the same data, and the churn definition moves them further. Below: the formulas, one worked example and the choices that decide whether LTV:CAC passes 3:1.
What you will learn
- LTV = profit per period × expected lifetime; for subscriptions, ARPA × gross margin ÷ churn rate
- In the sample, one customer base gives $1,667, $1,333, $1,062 or $795 depending only on the version used
- With a $400 CAC the ratio falls from 3.33 to 2.65 once LTV is discounted, so fix the formula before reading LTV:CAC
What is the LTV formula?
Customer lifetime value (LTV) is the profit a customer is expected to bring in before they leave. Every LTV formula is a version of one idea: profit per period × how many periods the customer stays.
For a subscription, the standard version is:
LTV = ARPA × gross margin ÷ churn rate
- ARPA is average revenue per account per period (a month, here).
- Gross margin is the share of that revenue left after the direct cost of serving the customer.
- Churn rate is the share of customers lost per period. Its inverse, 1 ÷ churn, is the expected lifetime in periods: 2% monthly churn means an average life of 50 months.
For a store, where there is no subscription, the same idea reads LTV = average order value × orders per year × years as a customer × gross margin. With a $60 average order, 2.5 orders a year, 3 years and a 40% margin, that is 60 × 2.5 × 3 × 0.40 = $180 of profit per customer ($450 of revenue).
The subscription form comes from treating retention as a constant rate: if you keep a fixed share of customers each month, the expected lifetime is 1 ÷ churn. David Skok's SaaS metrics guide uses this form and notes that it stops working when churn is very low or negative (source). For the short definition of the metric itself, see the LTV glossary entry.
Which LTV formula should you use?
There is no single standard, so the first job is to say which version a number is. These are the four you will meet:
| Version | Formula | Use it when | What it leaves out |
|---|---|---|---|
| Revenue LTV | ARPA ÷ churn | Early sanity check, revenue-only reporting | Cost of serving the customer |
| Margin LTV | ARPA × gross margin ÷ churn | Standard for subscriptions and for comparing with CAC | Time value of money |
| Discounted LTV | margin ÷ (1 − retention ÷ (1 + discount rate)) | Long customer lives, finance review, investor reporting | Expansion revenue unless modelled |
| Capped LTV | Margin summed over a fixed horizon (for example 36 months) | You have less than 2 years of data and do not want to extrapolate | Anything after the cap |
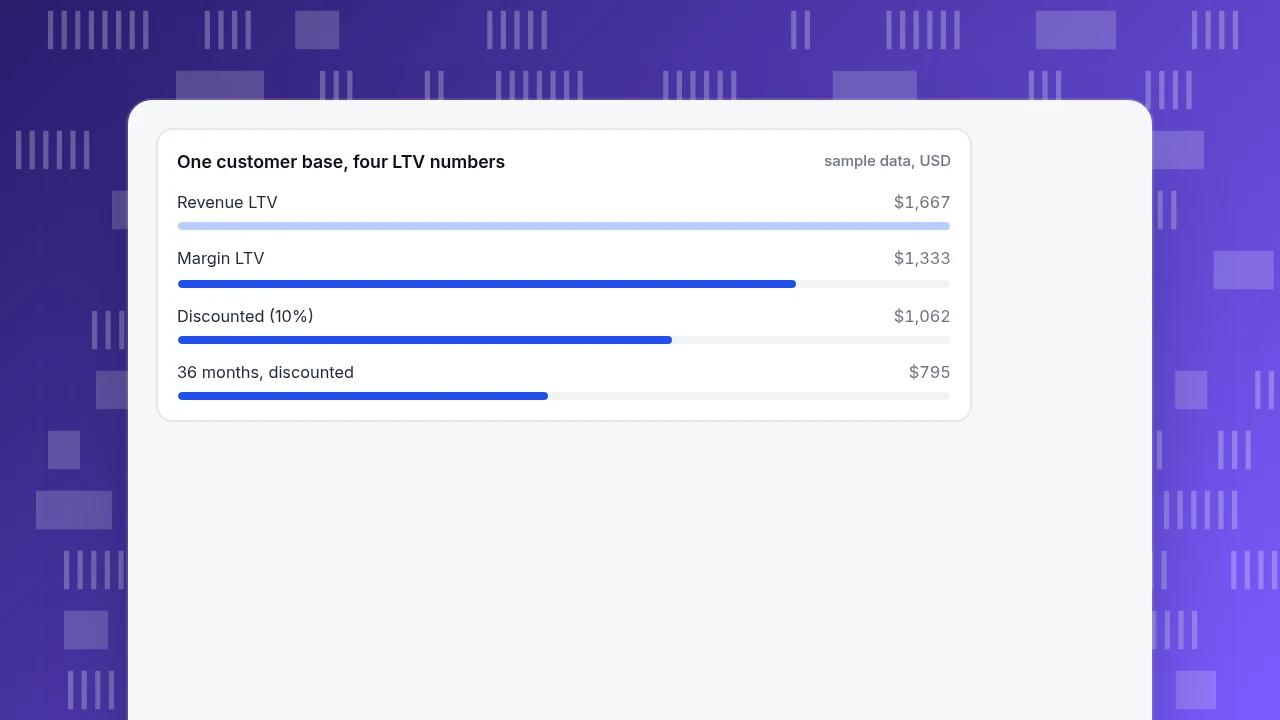
Pick one, write its name next to the number, and keep it fixed. The comparison in the next section shows why: the same customer base gives $1,667, $1,333, $1,062 or $795, depending only on the version.
| Version | Formula | Use it when |
|---|---|---|
| Revenue LTV | ARPA ÷ churn | Early sanity check, revenue-only reporting |
| Margin LTV | ARPA × gross margin ÷ churn | Standard for subscriptions and for comparing with CAC |
| Discounted LTV | margin ÷ (1 − retention ÷ (1 + discount rate)) | Long customer lives, finance review |
| Capped LTV | Margin summed over a fixed horizon, e.g. 36 months | Under 2 years of data, no extrapolation |
State the version next to every LTV number.
A worked example: one customer base, four LTV numbers
Sample data: a subscription product with $50 monthly revenue per account, an 80% gross margin and 3% monthly customer churn.
- Margin per account per month: 50 × 0.80 = $40.
- Expected lifetime: 1 ÷ 0.03 = 33.3 months.
- Revenue LTV: 50 ÷ 0.03 = $1,666.67.
- Margin LTV: 40 ÷ 0.03 = $1,333.33.
To discount, convert a 10% annual rate to a monthly one: 1.10^(1/12) − 1 = 0.797%. Assume the first month is collected at signup and each later month is collected only if the customer is still there, so month t is worth 40 × 0.97^t ÷ (1.00797)^t. The sum of that series is 40 × (1 + 0.00797) ÷ (1 + 0.00797 − 0.97) = $1,061.75.
Finally, cap it at 36 months with no discounting: 40 × (1 − 0.97^36) ÷ 0.03 = $887.96, and with discounting, $795.29.
Same customers, same churn, a spread of 2.1 times from top to bottom. None of them is wrong; they answer different questions. The mistake is comparing one team's revenue LTV with another team's discounted LTV.
One customer base, four LTV numbers
sample data, USDHow does the churn definition change LTV?
Churn is the input that moves the answer most, because it sits in the denominator. Three choices matter.
Customer churn or revenue churn. Customer churn counts accounts lost; revenue churn counts recurring revenue lost, so upgrades offset cancellations. Skok's guide defines both and works an example: losing 10 of 100 customers is 10% customer churn, while losing 10 accounts that carried $1,900 of a $55,000 MRR base is about 3.4% revenue churn (source). In our example, if expansion brought revenue churn down from 3% to 2%, margin LTV would jump from $1,333 to 40 ÷ 0.02 = $2,000. That is a 50% increase from a definition, not from any change in customer behaviour. Use customer churn for per-customer LTV; use revenue churn only if you also model expansion.
Monthly or annual. 3% monthly churn is not 36% annual churn, because losses compound: 1 − 0.97^12 = 30.6%. If someone converts that annual rate to a lifetime, 1 ÷ 0.306 = 3.27 years, or 39.2 months, against 33.3 months from the monthly rate. Pick the period at which you measure churn and divide by that same period; do not mix them.
Blended or by cohort. A single blended churn mixes new customers, who leave faster, with older ones. If you have at least a year of history, compute churn by signup cohort and by plan, and calculate LTV for each. A blended number hides the plan that is losing money.
When should you discount LTV?
Discount when customers stay long enough that distant profit is worth noticeably less today. Skok recommends discounting at the company's cost of capital, with rates from 10% for public companies to 20–25% for early-stage private ones, and notes that finance teams consider the undiscounted figure too high (source).
The longer the life, the more discounting removes. At a 10% annual rate, a 12-month expected life loses about 8% of its undiscounted value, the 33-month life in the example loses 20% (1,333 − 1,062 = $272), and a 60-month life loses about 32%. So a capped margin LTV is fine for short-lived products, and a discounted one is worth the effort once customers stay for several years.
Two practical rules:
- State the rate next to the number (for example, "discounted at 10% a year").
- If you compare a discounted LTV with a rule of thumb, say so; a ratio built on one method is not a fair test against a benchmark built on another.
How does LTV work with CAC?
LTV on its own cannot tell you whether growth pays. It becomes a decision when you set it against customer acquisition cost (CAC), the cost to win one customer. Skok's guideline is that the best SaaS businesses have an LTV:CAC ratio above 3, with an even better time to recover CAC of 5 to 7 months, and warns that profitability weakens when recovery takes more than 12 months (source). The ratio is covered in full in LTV to CAC ratio, and you can try numbers in the LTV:CAC calculator; the CAC glossary entry defines the cost side.
Take a CAC of $400 (sample data):
| LTV version | LTV | LTV:CAC | Passes 3:1? |
|---|---|---|---|
| Revenue LTV | $1,666.67 | 4.17 | Yes |
| Margin LTV | $1,333.33 | 3.33 | Yes |
| Discounted LTV (10%) | $1,061.75 | 2.65 | No |
| Capped, discounted (36 months) | $795.29 | 1.99 | No |
Margin payback is 400 ÷ 40 = 10 months, inside the 12-month warning line. So the business looks healthy on a margin basis and marginal on a discounted one. That is the useful finding: the choice of formula decides whether the headline passes a 3:1 test, so agree the formula before you read the ratio. The related CAC payback period is less sensitive to the formula because it only uses the first months.
What mistakes make an LTV number unreliable?
- Using revenue where profit is meant. At an 80% margin, revenue LTV overstates by 25%; at a 40% store margin it overstates 2.5 times.
- A churn rate from too short a window. One calm month can read 1% and push LTV to $4,000. Use at least three months, or a cohort curve.
- Dividing by zero churn. A new product with no cancellations has an infinite formula LTV. Use a capped LTV until churn is measurable.
- Mixing customer and revenue churn between the numerator and denominator, or between teams.
- Counting free or trial users in the customer base. Only paying customers belong in ARPA and churn.
- Ignoring segments. One blended LTV hides that some channels or plans have half the lifetime of others.
- Treating the result as a forecast. The formula assumes churn stays constant; revisit it each quarter.
How do you calculate LTV in TapCub?
Here is how a store would check the LTV example above with TapCub's analytics. TapCub measures revenue and customers; it does not compute margin, discounting or subscription billing, so those steps stay in your spreadsheet.
- See cumulative revenue per person. On All-platform analytics › Business › Commerce & revenue, the lifetime value view groups people by first-purchase month and shows cumulative revenue per person. That is a revenue LTV by cohort, the first row of the table above, for each month's new buyers.
- Apply your margin yourself. TapCub does not hold your cost of goods. Multiply the cohort's revenue by your gross margin (40% in the store example) to get margin LTV.
- Check how retention behaves. In All-platform analytics › Behavior › Behavior analysis, use retention to see how many of a cohort come back in each period. A flat tail suggests the constant-churn assumption is reasonable; a steep early drop means the blended formula is too optimistic.
- Get the cost side. All-platform analytics › Business › Channel ROI lets you import spend by day, channel, source or campaign, and shows cost per acquisition (spend ÷ purchases in orders). Use it as the CAC input, by channel.
- Compare cohorts and channels. Build segments in All-platform analytics › Users › Segments & tags (for example, buyers from one channel) and compare their revenue per person.
TapCub does not do subscription billing, so recurring-revenue churn, expansion and refunds from your payment system need to come in as your own events or stay outside it.
FAQ
What is the formula for LTV?
For a subscription: LTV = ARPA × gross margin ÷ churn rate. For a store: average order value × orders per year × years retained × gross margin. Both multiply profit per period by expected lifetime. Say which version you use, because revenue, margin, discounted and capped versions of the same business differ by up to two times.
How do you calculate LTV for SaaS?
Take monthly revenue per account, multiply by gross margin, and divide by monthly customer churn. At $50, an 80% margin and 3% churn that is 50 × 0.80 ÷ 0.03 = $1,333. Discount it at your cost of capital if customers stay more than about two to three years, and measure churn by cohort.
What does LTV mean in marketing?
It is the total profit a customer is expected to generate over their relationship with you. Marketers use it to decide how much they can spend to acquire a customer: CAC should sit well below LTV, with 3:1 a common guideline for SaaS. Use the margin-based version, not revenue, when comparing with spend.
Should LTV include gross margin?
Yes, for any decision about spend. Revenue LTV counts money that goes straight to the cost of serving the customer. In the example, revenue LTV was $1,667 and margin LTV $1,333. If you only have revenue, say so on the chart and do not compare it with a margin-based CAC benchmark.
What is a good LTV to CAC ratio?
A common guideline for subscription businesses is above 3:1, with CAC recovered within about 12 months. Both numbers depend on the formula. In the sample data, the ratio fell from 3.33 to 2.65 when the same customers were discounted at 10%, so check the method before comparing with a benchmark.
Sources
- David Skok. SaaS Metrics 2.0: Customer Lifetime Value, For Entrepreneurs: simple churn-based formula, discounted cash flow version and discount rates. Verified 2026-11-19.
- David Skok. SaaS Metrics 2.0: A Guide to Measuring and Improving What Matters, For Entrepreneurs: customer and revenue churn definitions, the 3:1 LTV:CAC guideline and CAC recovery times. Verified 2026-11-19.
Was this article helpful?
We use your answers to fix and expand this page.
Couldn’t send. Please try again in a minute.
Thanks for the feedback. We’ll use it to improve this page.You’ve already sent feedback on this page. Thanks.

Product Adoption Consultant
Explores customer onboarding, live conversations, and self-service, turning common usage questions into practical guidance and improvements.